
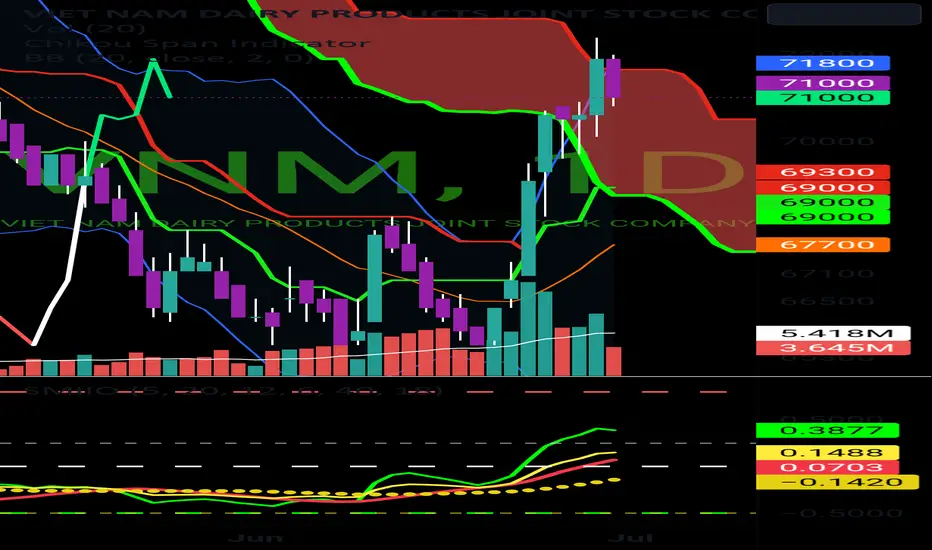
import pandas as pd
import ta.volatility as vol
# Load stock price data into a pandas DataFrame
df = pd.read_csv('stock_prices.csv')
# Calculate Bollinger Bands
df['bb_high'], df['bb_mid'], df['bb_low'] = vol.bollinger_hband(df['Close']), vol.bollinger_mavg(df['Close']), vol.bollinger_lband(df['Close'])
# Filter stock price movements that are above the upper Bollinger Band
df['above_bb_high'] = df['Close'] > df['bb_high']
# Filter stock price movements that are below the lower Bollinger Band
df['below_bb_low'] = df['Close'] < df['bb_low']
# Print the filtered stock price movements
print(df[df['above_bb_high'] | df['below_bb_low']])
import ta.volatility as vol
# Load stock price data into a pandas DataFrame
df = pd.read_csv('stock_prices.csv')
# Calculate Bollinger Bands
df['bb_high'], df['bb_mid'], df['bb_low'] = vol.bollinger_hband(df['Close']), vol.bollinger_mavg(df['Close']), vol.bollinger_lband(df['Close'])
# Filter stock price movements that are above the upper Bollinger Band
df['above_bb_high'] = df['Close'] > df['bb_high']
# Filter stock price movements that are below the lower Bollinger Band
df['below_bb_low'] = df['Close'] < df['bb_low']
# Print the filtered stock price movements
print(df[df['above_bb_high'] | df['below_bb_low']])

Declinazione di responsabilità
Le informazioni e le pubblicazioni non sono intese come, e non costituiscono, consulenza o raccomandazioni finanziarie, di investimento, di trading o di altro tipo fornite o approvate da TradingView. Per ulteriori informazioni, consultare i Termini di utilizzo.
Declinazione di responsabilità
Le informazioni e le pubblicazioni non sono intese come, e non costituiscono, consulenza o raccomandazioni finanziarie, di investimento, di trading o di altro tipo fornite o approvate da TradingView. Per ulteriori informazioni, consultare i Termini di utilizzo.