
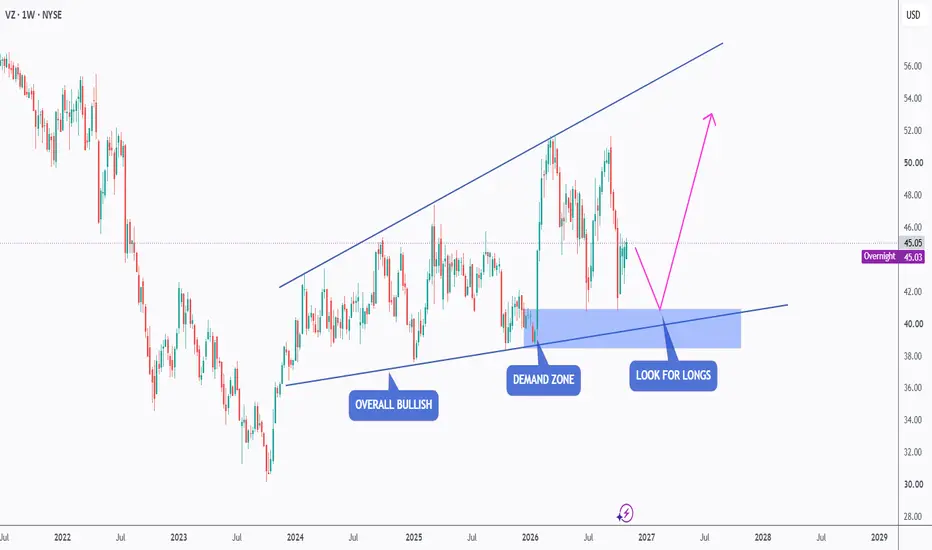
Verizon Communications (NYSE: VZ) has been overall bullish, trading within the rising flat wedge pattern marked in blue, with buyers maintaining control of the broader market structure.
However, price is currently undergoing a correction, bringing an important technical area back into focus.
📊 Technical Outlook
VZ has been respecting the boundaries of its rising wedge, with the lower blue trendline consistently acting as dynamic support.
As price approaches the lower boundary of the wedge, it will also be approaching a strong demand zone marked in blue around $38–$41.
This creates an interesting intersection of two technical factors:
🔵 Rising trendline support, which has supported the broader bullish structure.
🟢 Demand zone, where buyers have previously stepped in.
As long as this intersection holds, we will be looking for bullish confirmation and trend-following buy setups, anticipating another bullish wave toward the upper boundary of the wedge.
🐂 Preferred Scenario
Our preferred scenario is for VZ to continue its correction toward the lower blue trendline before attracting renewed buying interest.
A bullish rejection from this area could provide an opportunity to participate in the prevailing uptrend, with the upper boundary of the wedge serving as a potential longer-term target.
📌 Important Note
The bullish scenario remains valid as long as the lower boundary of the wedge and the demand zone continue to hold.
A confirmed breakdown below this intersection would weaken the bullish structure and require reassessment.
Remember, we don't buy simply because price reaches support. We wait for confirmation that buyers are stepping back in.
⚠️ Disclaimer: This analysis is provided for informational and educational purposes only. It does not constitute financial advice or a recommendation to buy or sell any security. Technical conditions can change, and no outcome is guaranteed. Always conduct your own research and manage risk appropriately.
📚 Stick to your trading plan regarding entries, risk, and management.
Good luck! 🍀
All Strategies Are Good; If Managed Properly!
~ Richard Nasr
However, price is currently undergoing a correction, bringing an important technical area back into focus.
📊 Technical Outlook
VZ has been respecting the boundaries of its rising wedge, with the lower blue trendline consistently acting as dynamic support.
As price approaches the lower boundary of the wedge, it will also be approaching a strong demand zone marked in blue around $38–$41.
This creates an interesting intersection of two technical factors:
🔵 Rising trendline support, which has supported the broader bullish structure.
🟢 Demand zone, where buyers have previously stepped in.
As long as this intersection holds, we will be looking for bullish confirmation and trend-following buy setups, anticipating another bullish wave toward the upper boundary of the wedge.
🐂 Preferred Scenario
Our preferred scenario is for VZ to continue its correction toward the lower blue trendline before attracting renewed buying interest.
A bullish rejection from this area could provide an opportunity to participate in the prevailing uptrend, with the upper boundary of the wedge serving as a potential longer-term target.
📌 Important Note
The bullish scenario remains valid as long as the lower boundary of the wedge and the demand zone continue to hold.
A confirmed breakdown below this intersection would weaken the bullish structure and require reassessment.
Remember, we don't buy simply because price reaches support. We wait for confirmation that buyers are stepping back in.
⚠️ Disclaimer: This analysis is provided for informational and educational purposes only. It does not constitute financial advice or a recommendation to buy or sell any security. Technical conditions can change, and no outcome is guaranteed. Always conduct your own research and manage risk appropriately.
📚 Stick to your trading plan regarding entries, risk, and management.
Good luck! 🍀
All Strategies Are Good; If Managed Properly!
~ Richard Nasr

📊I help you turn charts into a career
theSignalyst.com
Telegram
t.me/thesignalyst
Trusted Crypto Exchange
cutt.ly/qtwKuPaJ
Trusted CFD Broker
cutt.ly/TickmillReal
Trusted Crypto Prop Firm
cutt.ly/Hyrotrader
theSignalyst.com
Telegram
t.me/thesignalyst
Trusted Crypto Exchange
cutt.ly/qtwKuPaJ
Trusted CFD Broker
cutt.ly/TickmillReal
Trusted Crypto Prop Firm
cutt.ly/Hyrotrader
Declinazione di responsabilità
Le informazioni e le pubblicazioni non sono intese come, e non costituiscono, consulenza o raccomandazioni finanziarie, di investimento, di trading o di altro tipo fornite o approvate da TradingView. Per ulteriori informazioni, consultare i Termini di utilizzo.
📊I help you turn charts into a career
theSignalyst.com
Telegram
t.me/thesignalyst
Trusted Crypto Exchange
cutt.ly/qtwKuPaJ
Trusted CFD Broker
cutt.ly/TickmillReal
Trusted Crypto Prop Firm
cutt.ly/Hyrotrader
theSignalyst.com
Telegram
t.me/thesignalyst
Trusted Crypto Exchange
cutt.ly/qtwKuPaJ
Trusted CFD Broker
cutt.ly/TickmillReal
Trusted Crypto Prop Firm
cutt.ly/Hyrotrader
Declinazione di responsabilità
Le informazioni e le pubblicazioni non sono intese come, e non costituiscono, consulenza o raccomandazioni finanziarie, di investimento, di trading o di altro tipo fornite o approvate da TradingView. Per ulteriori informazioni, consultare i Termini di utilizzo.