WalMart stock is accelerating!
WalMart stock is accelerating!

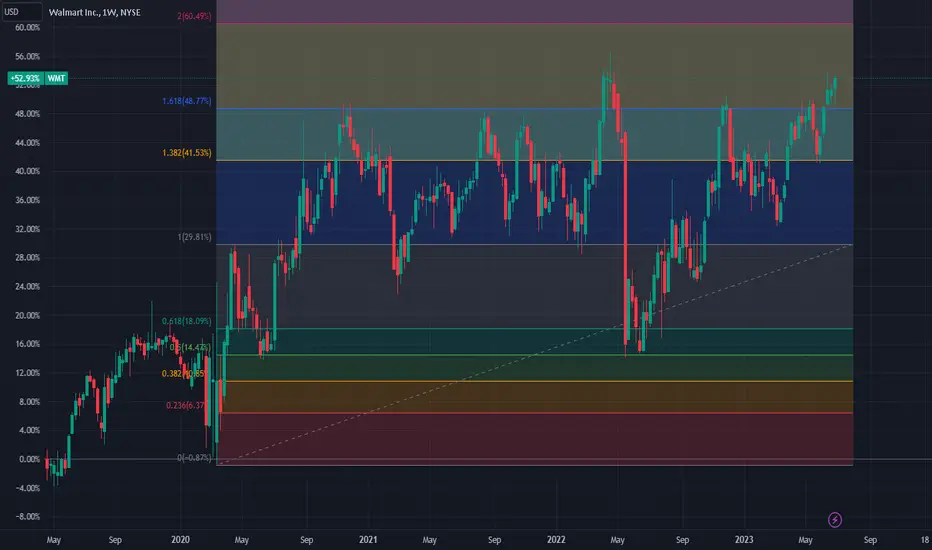
This chart shows the weekly candle chart of Wal Mart stock since the end of 2019. The graph overlays the golden section above the 2020 low point. As shown in the figure, the low point of Wal Mart stock in May this year just stepped back to 1.382 in the golden section of the figure, and the low point of the past three weeks just stepped back to 1.618 in the golden section of the figure! This shows that Wal Mart shares are in the early stage of accelerated growth, and the rate will probably break through the previous high! The next strong pressure level is the 2.000 position in the golden section of the graph (around 164.7)!
This chart shows the weekly candle chart of Wal Mart stock since the end of 2019. The graph overlays the golden section above the 2020 low point. As shown in the figure, the low point of Wal Mart stock in May this year just stepped back to 1.382 in the golden section of the figure, and the low point of the past three weeks just stepped back to 1.618 in the golden section of the figure! This shows that Wal Mart shares are in the early stage of accelerated growth, and the rate will probably break through the previous high! The next strong pressure level is the 2.000 position in the golden section of the graph (around 164.7)!

Declinazione di responsabilità
Le informazioni e le pubblicazioni non sono intese come, e non costituiscono, consulenza o raccomandazioni finanziarie, di investimento, di trading o di altro tipo fornite o approvate da TradingView. Per ulteriori informazioni, consultare i Termini di utilizzo.
Declinazione di responsabilità
Le informazioni e le pubblicazioni non sono intese come, e non costituiscono, consulenza o raccomandazioni finanziarie, di investimento, di trading o di altro tipo fornite o approvate da TradingView. Per ulteriori informazioni, consultare i Termini di utilizzo.