
WTI Poised for a Rally? Key Support Hold Could Send Prices Skywa
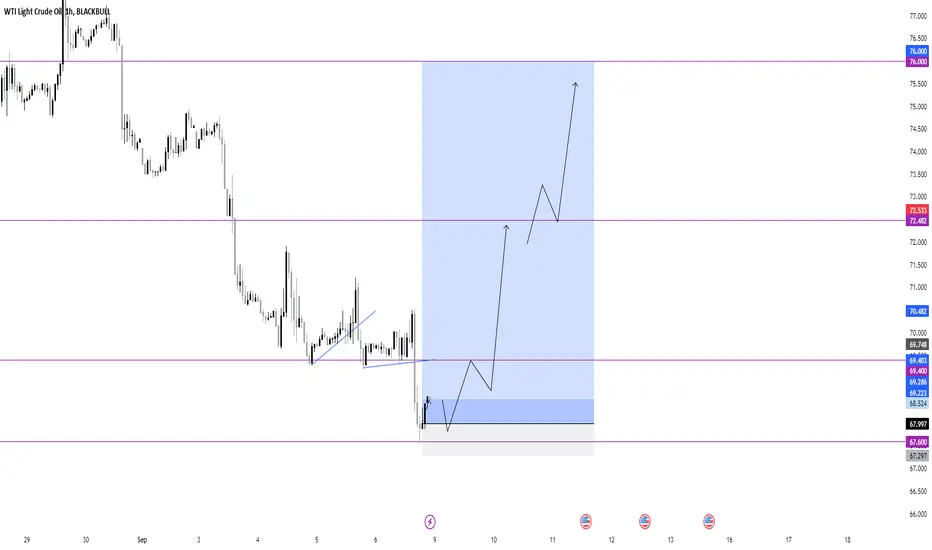
The chart indicates that WTI is approaching a critical support zone between $67.60 and $69.40, a level previously tested and held.
After forming a consolidation pattern, the price is likely to break upward, heading toward the next resistance at $72.50 and potentially extending to $76.00 if momentum builds.
A bullish move would be supported by the price remaining above the $69.40 area, indicating strong demand at these levels.
However, if this support breaks, there could be a further downward move towards $67.60.
The target zones to watch on the upside are $72.50 and $76.00, with significant resistance around those levels.
After forming a consolidation pattern, the price is likely to break upward, heading toward the next resistance at $72.50 and potentially extending to $76.00 if momentum builds.
A bullish move would be supported by the price remaining above the $69.40 area, indicating strong demand at these levels.
However, if this support breaks, there could be a further downward move towards $67.60.
The target zones to watch on the upside are $72.50 and $76.00, with significant resistance around those levels.

iSmashProfit
Pubblicazioni correlate
Declinazione di responsabilità
Le informazioni e le pubblicazioni non sono intese come, e non costituiscono, consulenza o raccomandazioni finanziarie, di investimento, di trading o di altro tipo fornite o approvate da TradingView. Per ulteriori informazioni, consultare i Termini di utilizzo.
iSmashProfit
Pubblicazioni correlate
Declinazione di responsabilità
Le informazioni e le pubblicazioni non sono intese come, e non costituiscono, consulenza o raccomandazioni finanziarie, di investimento, di trading o di altro tipo fornite o approvate da TradingView. Per ulteriori informazioni, consultare i Termini di utilizzo.