
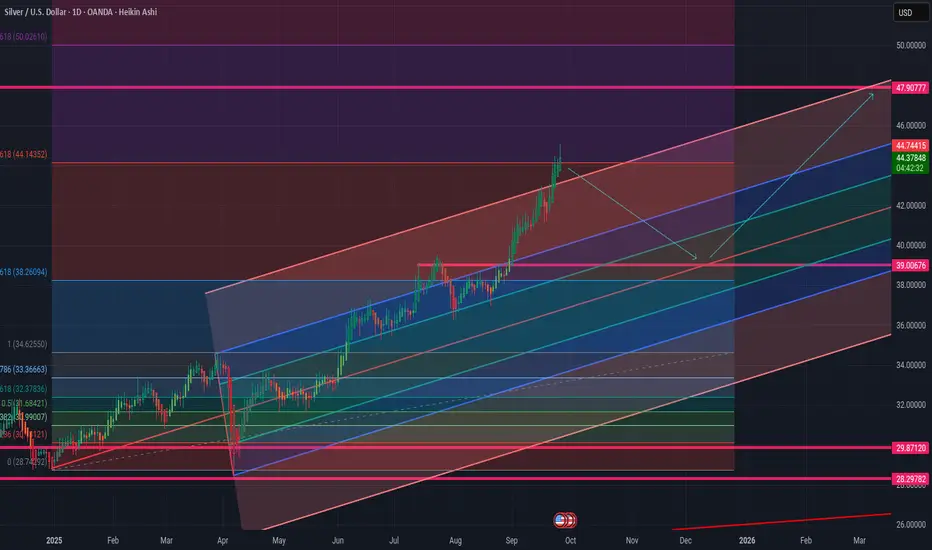
As can be seen in the chart; Fibonacci and Andrews fork are plotted in the same area. After many reactions to the fork ranges, the price has broken out of the fork and hit the Fibonacci resistance. It is likely that the price will return to the fork with this hit and will reject the next price resistances with the help of the fork channels.

Pubblicazioni correlate
Declinazione di responsabilità
Le informazioni e le pubblicazioni non sono intese come, e non costituiscono, consulenza o raccomandazioni finanziarie, di investimento, di trading o di altro tipo fornite o approvate da TradingView. Per ulteriori informazioni, consultare i Termini di utilizzo.
Pubblicazioni correlate
Declinazione di responsabilità
Le informazioni e le pubblicazioni non sono intese come, e non costituiscono, consulenza o raccomandazioni finanziarie, di investimento, di trading o di altro tipo fornite o approvate da TradingView. Per ulteriori informazioni, consultare i Termini di utilizzo.