
1. The Macro Context (The "Why") 🌍
Hi traders! Before looking at the candles, let's look at the money. My fundamental scoring table is giving us a mixed signal: we have a +0 differential, pointing toward a Neutral bias — the macro forces are in equilibrium, with bullish and bearish drivers canceling each other out. 🏦
Key Factor Analysis:
🏦 Real Yields (DFII10): Explanation: 10Y real yields running high at 1.98% (MA20) and climbing — both level and momentum are headwinds for non-yielding silver. Score: -2
🌍 Dollar & Inflation: Explanation: Weak dollar (DXY MA20: 98.61) and above-average inflation breakevens (MA20: 2.46%) — both tailwinds for precious metals. Score DXY: +1 | Score T10YIE: +1
📊 Fed Expectations: Explanation: Markets pricing in rate hikes with spread below MA20 (-0.30%) — a hawkish shift that weighs on silver. Score: -2
⚖️ Industrial Demand (Copper Momentum): Explanation: Strong copper momentum signals robust industrial expansion, directly bullish for silver's dual industrial/monetary profile. Score: +2
🏛️ COT & Valuation: Explanation: Rebuilding USD short positions (inverted, +1) offset by gold/silver ratio at 59.5 suggesting relative silver overvaluation vs gold (-1). Score: 0
Score Summary:
Total Score XAG/USD: +0 (Neutral)
Synthesis:
💡 Bullish Drivers (Score +4): Weak dollar, above-average inflation expectations, and strong copper momentum provide a supportive industrial-macro floor for silver.
💡 Bearish Drivers (Score -4): Elevated real yields and hawkish Fed expectations create competing headwinds that cap upside conviction from a pure macro standpoint.
Conclusion: With a neutral macro score, the fundamentals alone don't provide a directional edge. However, they are not opposing our long bias either. In this scenario, we lean on the structural alignment — daily trend confirmation and 15m setup quality — to validate our long thesis. 🚫
2. Daily Trend Confirmation (The "Structural Filter") 📅
Macro tells us where the wind blows; the daily chart tells us if the price is actually moving with it. For every swing setup I take, the 1D structure must confirm the macro direction — otherwise the trade is just a guess against the tape.
📅 Daily Trend: Uptrend — the daily structure is printing higher highs and higher lows, confirming a bullish directional bias on the highest timeframe with a 65.4% continuation rate.
🔄 Daily Phase: Monitoring for new breakout — the indicator just validated a new HH on the daily, so we're entering the new impulse leg or its pullback. This is the highest-quality structural phase for swing entries.
Coherence Check: The 1D trend is partially aligned with the macro bias. While the macro score is neutral (not directionally supportive), the daily structure is clearly bullish with a strong 65.4% continuation rate. The absence of macro headwinds combined with a confirmed daily uptrend gives us a moderate-conviction long setup — we proceed with the technical edge but size accordingly.
3. The Technical Setup (The "Where") 📉
Timeframe: 15m | Pair: XAGUSD
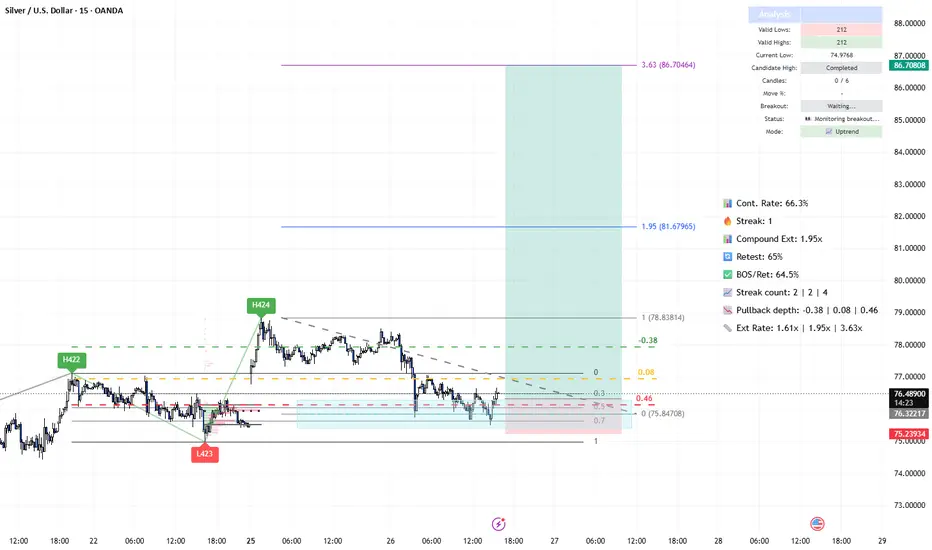
The SMC Market Structure + Price Zones [MaB] indicator has confirmed our statistical edge. Here's the probabilistic data from the dashboard:
🚀 Continuation Rate (66.3%): We are currently above the 60% threshold. This confirms a healthy directional trend where continuation has a much higher probability than a reversal.
🔥 Streak Analysis (1): We are currently on impulse number 1.
* Expected Streak: 2 (Percentile: <20%)
* Remaining Moves: 1
This indicates a Young trend. The statistical range (20th-80th pct) suggests a typical duration of 2-4 impulses.
🔄 Retest & Reaction:
* Retest Prob (65%): The probability of the price returning to test the zone after a BOS.
* BOS/Ret Rate (64.5%): Once inside the zone, this is the probability of a positive reaction leading to a new BOS.
🎯 Extension & Projection:
* Extension Range: The expected extension for this single leg is between 1.61x and 3.63x (Expected: 1.95x).
* Compound Extension (1.95x): This is the total projected move based on the remaining expected impulses. By multiplying the current zone height by this factor, we find our ultimate target.
4. Execution Plan on Chart 🎯
Moving over to the charts, we are using these statistics to define our operational levels:
📍 Entry and Stop Loss: We are placing a limit entry within the Demand Zone (Purple Band). The stop loss is tucked a few pips outside the zone to protect against structural invalidation.
🏁 Statistical Take Profits (50/30/20 split): Instead of a single arbitrary target, we split the position across 3 extension levels projected by the indicator. Each TP closes a portion of the position to lock in profit progressively. 🏆
Trade Parameters:
💰 Entry Price: 75.84708
🛡️ Stop Loss: 74.52
🎯 Take Profit Strategy (50/30/20 lot split):
* TP1 (close 50% of position): 80.66 — 1.61x extension
* TP2 (close 30% of position): 81.67965 — 1.95x extension
* TP3 (close 20% of position): 86.70464 — 3.63x extension
The 50/30/20 split secures profit at the statistically conservative target (TP1) while letting a portion ride toward the max extension (TP3).
⚠️ Disclaimer: This analysis is based on a proprietary algorithm and is shared exclusively for educational and didactic purposes. It does not constitute financial advice or investment solicitation in any way. Trading involves significant risk.

Trading indicators development focused on Smart Money Concepts (SMC), market structure analysis, and liquidity zones.
WEBSITE: mab-arreca.com/
WHOP: whop.com/mab-9cb1/
YOUTUBE: youtube.com/@MaB.arreca
WEBSITE: mab-arreca.com/
WHOP: whop.com/mab-9cb1/
YOUTUBE: youtube.com/@MaB.arreca
Pubblicazioni correlate
Declinazione di responsabilità
Le informazioni e le pubblicazioni non sono intese come, e non costituiscono, consulenza o raccomandazioni finanziarie, di investimento, di trading o di altro tipo fornite o approvate da TradingView. Per ulteriori informazioni, consultare i Termini di utilizzo.
Trading indicators development focused on Smart Money Concepts (SMC), market structure analysis, and liquidity zones.
WEBSITE: mab-arreca.com/
WHOP: whop.com/mab-9cb1/
YOUTUBE: youtube.com/@MaB.arreca
WEBSITE: mab-arreca.com/
WHOP: whop.com/mab-9cb1/
YOUTUBE: youtube.com/@MaB.arreca
Pubblicazioni correlate
Declinazione di responsabilità
Le informazioni e le pubblicazioni non sono intese come, e non costituiscono, consulenza o raccomandazioni finanziarie, di investimento, di trading o di altro tipo fornite o approvate da TradingView. Per ulteriori informazioni, consultare i Termini di utilizzo.