
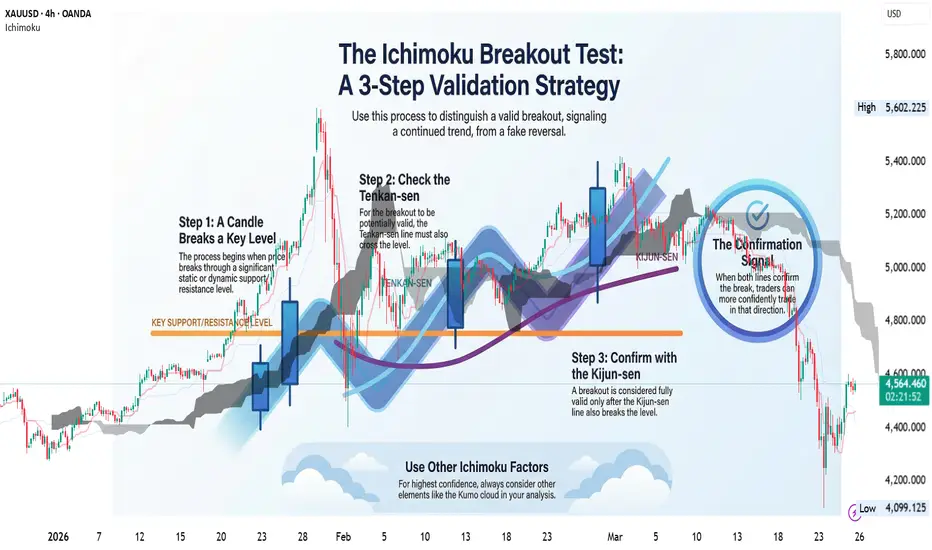
🎯 1. The Big Question: Is This Breakout Real? ❓
Welcome to the world of trading! 🌎📈 As you begin analyzing charts 📊, one of the most common and critical events you'll encounter is a breakout — a moment when the price moves decisively through a key level of support or resistance 🚪💥. The challenge is that not all breakouts are created equal ⚠️.
Understanding the difference between a real move ✅ and a false one ❌ is fundamental to making sound decisions 🧠🎯.
• Valid Breakout: ✅ This is a real move. The price breaks through a level and continues to move in that direction ➡️📈, presenting a potential trading opportunity 💰.
• Fake Breakout (or "Fakeout"): 🎭❌ This is a false move. The price briefly breaks through a level, only to quickly reverse and move back 🔄😰. Acting on a fakeout can lead to frustrating losses 💸😤.
While many traders try to judge a breakout by looking at the price candle alone 🕯️👀, this can be misleading 🚫. We're going to use a more reliable method 💪 that confirms the move with underlying market momentum ⚡📊. This guide will introduce a simple, two-step method 2️⃣✅ using a popular indicator to help you build confidence in telling the difference 🎯. The fundamental challenge all traders face begins with the nature of price levels themselves 🏛️.
2. Why Levels Don't Last Forever ⏰🏛️
In technical analysis, we spend a lot of time identifying reliable price levels where the market has reacted in the past 📍. These can be static horizontal lines ➖ or dynamic trendlines 📐. However, it's crucial to remember that no level holds forever 🚫⏳. Eventually, the price will break through 💥.
This inevitability creates the central challenge for a trader 🤔: when a price level finally breaks, how can you determine if the breakout is real ✅, or if it's a trap 🪤 designed to lure traders in just before the price reverses course 🔄💸? To answer this, we'll use a powerful confirmation tool 🛠️⚡.
3. Introducing Your Confirmation Tool: The Ichimoku Indicator ☁️🎯
The Ichimoku indicator might look complex at first 🤯, but it's an incredibly powerful tool for understanding market momentum ⚡ and structure 🏗️. For our purpose, you don't need to master the entire system right away 🎓➡️. We will focus on just two key components 2️⃣🔑 that reveal the strength behind a price move 💪📈.
The Tenkan-sen represents short-term price momentum ⚡🏃, while the Kijun-sen represents the medium-term price equilibrium ⚖️📏. A true breakout needs both short-term momentum (Tenkan-sen) and a shift in the underlying market balance (Kijun-sen) to confirm its strength ✅💪.
Think of it this way 🧠💡: the Tenkan-sen is your fast-moving scout 🏃♂️🔍, and the Kijun-sen is the main army 🏰⚔️.
• Tenkan-sen: 🏃♂️ Our first confirmation checkpoint (the scout) 🔍1️⃣.
• Kijun-sen: 🏰 Our final confirmation checkpoint (the main army) 🔍2️⃣✅.
For a successful invasion (a valid breakout) 🏆, you need the scout to cross the enemy line first 🏃♂️🚪, followed by the main army to secure the territory 🏰✅. If only the scout crosses 🏃♂️❌, it's likely a trap 🪤. By observing these two lines, we can build a much more reliable picture of a breakout's validity 📸🎯.
Now, let's walk through the exact process 👣📋.
4. A Simple Two-Step Process for Breakout Confirmation 2️⃣✅
When you see a price candle break through a key level 🕯️💥, this is where discipline comes in 🧘🎯. Instead of jumping in impulsively 🚫🏃, follow this process to stay out of low-probability trades 📉❌.
1️⃣ Step 1: Check the Tenkan-sen. ✅
Once a candle closes across the level 🕯️✅, your first job is to check if the Tenkan-sen has followed 🏃♂️➡️. If the Tenkan-sen has not also crossed the level 🚫, you must treat the breakout as invalid ❌. It's a high-risk signal of a potential fakeout 🎭😰. However, if the Tenkan-sen also breaks through ✅, you have your first positive sign 👍 and can proceed to the next step ➡️.
2️⃣ Step 2: Get Final Confirmation from the Kijun-sen. ✅🏰
Only after the Tenkan-sen has crossed ✅ do you look for the Kijun-sen 🏰. If the Kijun-sen also breaks through the same level ✅🚪, the breakout is considered completely valid 🏆💯. At this point, you can have much higher confidence 💪🎯 to trade in the direction of the breakout 📈.
5. Quick Reference: The Breakout Validity Checklist 📋✅
To make this process easy to remember 🧠💡, use this simple checklist:
• Candle breaks the level, but Tenkan-sen does not 🕯️✅🏃♂️❌ = Invalid Breakout 🚫
• Candle and Tenkan-sen break, but Kijun-sen does not 🕯️✅🏃♂️✅🏰❌ = Unconfirmed Breakout ⚠️. Avoid entry and wait for Kijun-sen confirmation ⏳🎯.
• Candle, Tenkan-sen, and Kijun-sen all break the level 🕯️✅🏃♂️✅🏰✅ = Completely Valid Breakout 🏆💯🎯
6. An Important Final Reminder ⚠️🎓
While this two-step process using the Tenkan-sen and Kijun-sen is a powerful technique 💪🛠️, the most reliable trading decisions come from a comprehensive view of the market 🌍📊. For the highest level of confidence 💯, it is a best practice to consider other factors within the Ichimoku system, such as the position of the cloud (the "Kumo") ☁️, in your analysis 🧩. Think of this method as one strong component 🔧 of a complete trading strategy 🎯🏆.
7. Conclusion: Trading with More Confidence 🎓💪
Learning to distinguish between real and fake breakouts ✅❌ is a skill that separates disciplined traders 🧘📈 from the crowd 👥. Instead of relying solely on a price candle breaking a line 🕯️🚫, you now have a structured, two-step confirmation process 📋2️⃣✅. By waiting for the Tenkan-sen and Kijun-sen to validate the move 🏃♂️✅🏰✅, you can filter out many false signals 🚫🎣 and make more informed decisions 🧠🎯.
This method isn't just a technical rule 📏; it's a lesson in patience ⏳🧘. By waiting for confirmation ✅, you are fundamentally shifting the odds in your favor 🎲➡️🏆.
Welcome to the world of trading! 🌎📈 As you begin analyzing charts 📊, one of the most common and critical events you'll encounter is a breakout — a moment when the price moves decisively through a key level of support or resistance 🚪💥. The challenge is that not all breakouts are created equal ⚠️.
Understanding the difference between a real move ✅ and a false one ❌ is fundamental to making sound decisions 🧠🎯.
• Valid Breakout: ✅ This is a real move. The price breaks through a level and continues to move in that direction ➡️📈, presenting a potential trading opportunity 💰.
• Fake Breakout (or "Fakeout"): 🎭❌ This is a false move. The price briefly breaks through a level, only to quickly reverse and move back 🔄😰. Acting on a fakeout can lead to frustrating losses 💸😤.
While many traders try to judge a breakout by looking at the price candle alone 🕯️👀, this can be misleading 🚫. We're going to use a more reliable method 💪 that confirms the move with underlying market momentum ⚡📊. This guide will introduce a simple, two-step method 2️⃣✅ using a popular indicator to help you build confidence in telling the difference 🎯. The fundamental challenge all traders face begins with the nature of price levels themselves 🏛️.
2. Why Levels Don't Last Forever ⏰🏛️
In technical analysis, we spend a lot of time identifying reliable price levels where the market has reacted in the past 📍. These can be static horizontal lines ➖ or dynamic trendlines 📐. However, it's crucial to remember that no level holds forever 🚫⏳. Eventually, the price will break through 💥.
This inevitability creates the central challenge for a trader 🤔: when a price level finally breaks, how can you determine if the breakout is real ✅, or if it's a trap 🪤 designed to lure traders in just before the price reverses course 🔄💸? To answer this, we'll use a powerful confirmation tool 🛠️⚡.
3. Introducing Your Confirmation Tool: The Ichimoku Indicator ☁️🎯
The Ichimoku indicator might look complex at first 🤯, but it's an incredibly powerful tool for understanding market momentum ⚡ and structure 🏗️. For our purpose, you don't need to master the entire system right away 🎓➡️. We will focus on just two key components 2️⃣🔑 that reveal the strength behind a price move 💪📈.
The Tenkan-sen represents short-term price momentum ⚡🏃, while the Kijun-sen represents the medium-term price equilibrium ⚖️📏. A true breakout needs both short-term momentum (Tenkan-sen) and a shift in the underlying market balance (Kijun-sen) to confirm its strength ✅💪.
Think of it this way 🧠💡: the Tenkan-sen is your fast-moving scout 🏃♂️🔍, and the Kijun-sen is the main army 🏰⚔️.
• Tenkan-sen: 🏃♂️ Our first confirmation checkpoint (the scout) 🔍1️⃣.
• Kijun-sen: 🏰 Our final confirmation checkpoint (the main army) 🔍2️⃣✅.
For a successful invasion (a valid breakout) 🏆, you need the scout to cross the enemy line first 🏃♂️🚪, followed by the main army to secure the territory 🏰✅. If only the scout crosses 🏃♂️❌, it's likely a trap 🪤. By observing these two lines, we can build a much more reliable picture of a breakout's validity 📸🎯.
Now, let's walk through the exact process 👣📋.
4. A Simple Two-Step Process for Breakout Confirmation 2️⃣✅
When you see a price candle break through a key level 🕯️💥, this is where discipline comes in 🧘🎯. Instead of jumping in impulsively 🚫🏃, follow this process to stay out of low-probability trades 📉❌.
1️⃣ Step 1: Check the Tenkan-sen. ✅
Once a candle closes across the level 🕯️✅, your first job is to check if the Tenkan-sen has followed 🏃♂️➡️. If the Tenkan-sen has not also crossed the level 🚫, you must treat the breakout as invalid ❌. It's a high-risk signal of a potential fakeout 🎭😰. However, if the Tenkan-sen also breaks through ✅, you have your first positive sign 👍 and can proceed to the next step ➡️.
2️⃣ Step 2: Get Final Confirmation from the Kijun-sen. ✅🏰
Only after the Tenkan-sen has crossed ✅ do you look for the Kijun-sen 🏰. If the Kijun-sen also breaks through the same level ✅🚪, the breakout is considered completely valid 🏆💯. At this point, you can have much higher confidence 💪🎯 to trade in the direction of the breakout 📈.
5. Quick Reference: The Breakout Validity Checklist 📋✅
To make this process easy to remember 🧠💡, use this simple checklist:
• Candle breaks the level, but Tenkan-sen does not 🕯️✅🏃♂️❌ = Invalid Breakout 🚫
• Candle and Tenkan-sen break, but Kijun-sen does not 🕯️✅🏃♂️✅🏰❌ = Unconfirmed Breakout ⚠️. Avoid entry and wait for Kijun-sen confirmation ⏳🎯.
• Candle, Tenkan-sen, and Kijun-sen all break the level 🕯️✅🏃♂️✅🏰✅ = Completely Valid Breakout 🏆💯🎯
6. An Important Final Reminder ⚠️🎓
While this two-step process using the Tenkan-sen and Kijun-sen is a powerful technique 💪🛠️, the most reliable trading decisions come from a comprehensive view of the market 🌍📊. For the highest level of confidence 💯, it is a best practice to consider other factors within the Ichimoku system, such as the position of the cloud (the "Kumo") ☁️, in your analysis 🧩. Think of this method as one strong component 🔧 of a complete trading strategy 🎯🏆.
7. Conclusion: Trading with More Confidence 🎓💪
Learning to distinguish between real and fake breakouts ✅❌ is a skill that separates disciplined traders 🧘📈 from the crowd 👥. Instead of relying solely on a price candle breaking a line 🕯️🚫, you now have a structured, two-step confirmation process 📋2️⃣✅. By waiting for the Tenkan-sen and Kijun-sen to validate the move 🏃♂️✅🏰✅, you can filter out many false signals 🚫🎣 and make more informed decisions 🧠🎯.
This method isn't just a technical rule 📏; it's a lesson in patience ⏳🧘. By waiting for confirmation ✅, you are fundamentally shifting the odds in your favor 🎲➡️🏆.

Queenichi 👑
Declinazione di responsabilità
Le informazioni e le pubblicazioni non sono intese come, e non costituiscono, consulenza o raccomandazioni finanziarie, di investimento, di trading o di altro tipo fornite o approvate da TradingView. Per ulteriori informazioni, consultare i Termini di utilizzo.
Queenichi 👑
Declinazione di responsabilità
Le informazioni e le pubblicazioni non sono intese come, e non costituiscono, consulenza o raccomandazioni finanziarie, di investimento, di trading o di altro tipo fornite o approvate da TradingView. Per ulteriori informazioni, consultare i Termini di utilizzo.