
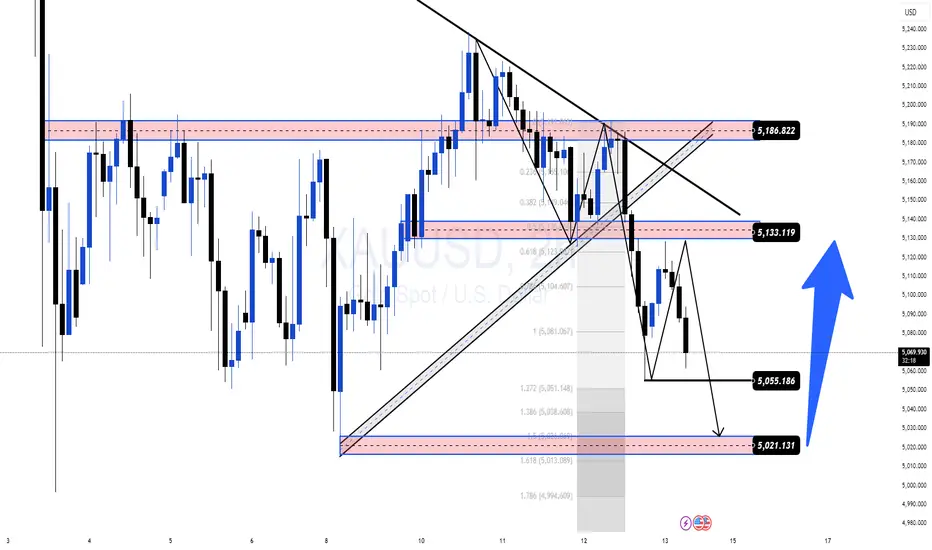
Gold’s short-term bullish structure has recently been broken, signaling that the market may be shifting from an upward recovery phase into a corrective move.
One key factor behind this shift is the strengthening U.S. Dollar (DXY), which is putting additional pressure on gold prices. At the same time, market sentiment appears to be stabilizing as investors monitor the possibility of ceasefire negotiations in the Middle East, reducing immediate safe-haven demand.
This combination could be the trigger for a larger pullback phase for XAUUSD.
Market Context
From a broader perspective, gold had previously formed a series of higher lows along an ascending trendline, supporting the short-term bullish momentum.
However, the latest price action shows that the market has broken below this rising structure, confirming a short-term trend shift. This type of structural break often signals that the market is transitioning into a liquidity rotation toward lower support zones.
Technical Overview
Price has now lost the key support area around 5133, which previously acted as the main demand zone for buyers.
The breakdown suggests that sellers may attempt to push the market toward lower liquidity pools, especially as the structure below begins to open.
Key resistance and support zones are now clearly defined.
Key Levels
Resistance
• 5186 – Key supply / previous rejection zone
Broken structure level
• 5133
Next downside targets
• 5055
• 5021
IF–THEN Scenarios
📉 Bearish Scenario
As long as price remains below 5133, the downside pressure could continue with potential targets at:
• 5055
• 5021
This would represent a continuation of the corrective move after the structure break.
📈 Bullish Recovery Scenario
If price manages to reclaim 5133 and hold above it, the breakdown could turn into a false breakout, opening the path for a recovery move back toward:
• 5186
Technical Insight
The recent move highlights a classic break of structure (BOS) after a rising trendline was lost. When this occurs, markets often rotate toward lower liquidity zones before establishing a new equilibrium.
Traders should closely watch how price reacts around 5133, as it will likely determine whether gold continues its correction or attempts a recovery.
Trader Question
Do you think gold will continue correcting toward 5055–5020, or could the market reclaim 5133 and trigger a bullish recovery?
One key factor behind this shift is the strengthening U.S. Dollar (DXY), which is putting additional pressure on gold prices. At the same time, market sentiment appears to be stabilizing as investors monitor the possibility of ceasefire negotiations in the Middle East, reducing immediate safe-haven demand.
This combination could be the trigger for a larger pullback phase for XAUUSD.
Market Context
From a broader perspective, gold had previously formed a series of higher lows along an ascending trendline, supporting the short-term bullish momentum.
However, the latest price action shows that the market has broken below this rising structure, confirming a short-term trend shift. This type of structural break often signals that the market is transitioning into a liquidity rotation toward lower support zones.
Technical Overview
Price has now lost the key support area around 5133, which previously acted as the main demand zone for buyers.
The breakdown suggests that sellers may attempt to push the market toward lower liquidity pools, especially as the structure below begins to open.
Key resistance and support zones are now clearly defined.
Key Levels
Resistance
• 5186 – Key supply / previous rejection zone
Broken structure level
• 5133
Next downside targets
• 5055
• 5021
IF–THEN Scenarios
📉 Bearish Scenario
As long as price remains below 5133, the downside pressure could continue with potential targets at:
• 5055
• 5021
This would represent a continuation of the corrective move after the structure break.
📈 Bullish Recovery Scenario
If price manages to reclaim 5133 and hold above it, the breakdown could turn into a false breakout, opening the path for a recovery move back toward:
• 5186
Technical Insight
The recent move highlights a classic break of structure (BOS) after a rising trendline was lost. When this occurs, markets often rotate toward lower liquidity zones before establishing a new equilibrium.
Traders should closely watch how price reacts around 5133, as it will likely determine whether gold continues its correction or attempts a recovery.
Trader Question
Do you think gold will continue correcting toward 5055–5020, or could the market reclaim 5133 and trigger a bullish recovery?
Trade attivo
+872 PIP - Gold falls sharply after news.
Trade chiuso: obiettivo raggiunto
THAT'S GOOD :))
Next target: 44xx-48xx

⚜️Trade with Money Market Flow, logic, Price action
🔥Live Market Updates-Realtime Trading Plans & Signal
t.me/+sBwjxIJbdoFmNjk1
⚜️Risk Reward 1.3 to 2.5...
⚜️Daily 8 to 16 Signals VIP
MMFLOW gives you precision entries & BIGWIN profits
🔥Live Market Updates-Realtime Trading Plans & Signal
t.me/+sBwjxIJbdoFmNjk1
⚜️Risk Reward 1.3 to 2.5...
⚜️Daily 8 to 16 Signals VIP
MMFLOW gives you precision entries & BIGWIN profits
Declinazione di responsabilità
Le informazioni e le pubblicazioni non sono intese come, e non costituiscono, consulenza o raccomandazioni finanziarie, di investimento, di trading o di altro tipo fornite o approvate da TradingView. Per ulteriori informazioni, consultare i Termini di utilizzo.
⚜️Trade with Money Market Flow, logic, Price action
🔥Live Market Updates-Realtime Trading Plans & Signal
t.me/+sBwjxIJbdoFmNjk1
⚜️Risk Reward 1.3 to 2.5...
⚜️Daily 8 to 16 Signals VIP
MMFLOW gives you precision entries & BIGWIN profits
🔥Live Market Updates-Realtime Trading Plans & Signal
t.me/+sBwjxIJbdoFmNjk1
⚜️Risk Reward 1.3 to 2.5...
⚜️Daily 8 to 16 Signals VIP
MMFLOW gives you precision entries & BIGWIN profits
Declinazione di responsabilità
Le informazioni e le pubblicazioni non sono intese come, e non costituiscono, consulenza o raccomandazioni finanziarie, di investimento, di trading o di altro tipo fornite o approvate da TradingView. Per ulteriori informazioni, consultare i Termini di utilizzo.