
By analyzing the #Gold chart on the 2-hour timeframe, we can see that after the war headlines hit the market, Gold experienced extreme volatility. Price initially surged aggressively toward the $5420 level, creating a strong impulsive move to the upside.
During this move, a price gap was formed between $5280 and $5300, which was quickly filled. However, the market did not stop there and selling pressure intensified, pushing Gold sharply lower toward the $4995 level.
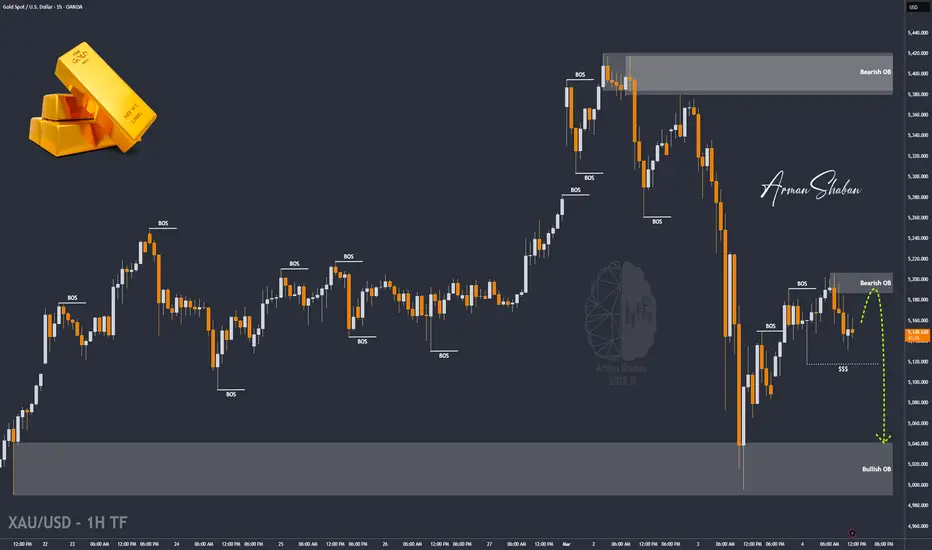
Currently, Gold is trading around the $5150 area. The market is now at a critical decision point where the reaction around key levels will determine the next directional move.
If price fails to stabilize above the $5200 resistance level, further downside pressure could follow. In that case, the next potential downside targets are $5120, $5100, and $5080.
On the other hand, if buyers manage to break and hold above $5200, we may see a bullish recovery toward the $5320 region.
Please support me with your likes and comments to motivate me to share more analysis with you and share your opinion about the possible trend of this chart with me !
Best Regards , Arman Shaban
During this move, a price gap was formed between $5280 and $5300, which was quickly filled. However, the market did not stop there and selling pressure intensified, pushing Gold sharply lower toward the $4995 level.
Currently, Gold is trading around the $5150 area. The market is now at a critical decision point where the reaction around key levels will determine the next directional move.
If price fails to stabilize above the $5200 resistance level, further downside pressure could follow. In that case, the next potential downside targets are $5120, $5100, and $5080.
On the other hand, if buyers manage to break and hold above $5200, we may see a bullish recovery toward the $5320 region.
Please support me with your likes and comments to motivate me to share more analysis with you and share your opinion about the possible trend of this chart with me !
Best Regards , Arman Shaban
Trade attivo
By analyzing the #Gold chart on the 1-hour timeframe, we can see that this analysis played out exactly as expected. Price initially pushed higher and reached the $5195 supply zone, where strong selling pressure stepped in once again.After reacting from this level, Gold started a sharp bearish move and continued dropping aggressively toward the downside levels we discussed. With this move, all three projected targets were successfully reached: $5120, $5100, and $5080.
This move pushed the total return of this analysis to more than 1100 pips, confirming once again the accuracy of reactions from key supply zones and structural levels.
Trade chiuso: obiettivo raggiunto
By analyzing the #Gold chart on the 1-hour timeframe, we can see that after the previous analysis played out and all downside targets were reached, price continued its volatility and dropped further toward the $5050 level.After reaching this zone, buying pressure stepped in once again and pushed Gold higher toward the $5144 level. However, the market could not maintain that strength and another corrective move followed.
Currently, Gold is trading around the $5078 area, showing continued volatility as the market reacts to key structural levels.
If price manages to stabilize above the $5060 support level, we may expect further bullish recovery from this region.
In that case, the next upside targets to monitor are $5090, followed by $5100, then $5120, and finally $5140 in case bullish momentum continues to build.
Nota
By analyzing the #Gold chart on the 1-hour timeframe, we can see that after the NFP data release, Gold started another bullish expansion exactly from the levels discussed in the previous analysis. Following this move, price successfully reached the upside targets we projected earlier. Gold hit the $5090, $5100, and $5120 targets, and even continued pushing higher toward the $5132 level, getting very close to the final upside objective.This move pushed the total return of this setup to more than 550 pips, confirming once again the strength of reactions from key structural levels. I hope many of you managed to take advantage of this move and capture a good portion of the momentum. As always, this chart will continue to be updated step by step as price reacts to the next important levels.

📘 Wanna Learn ICT & SMC? Get the Full Book Here : bit.ly/ICT-BOOK
⚜️ Free Telegram Channel : telegram.me/PriceAction_ICT
⚜️ JOIN THE VIP 👉 t.me/ArmanShabanTrading
🚀 MondFX — our trusted Broker : bit.ly/MondFx
⚜️ Free Telegram Channel : telegram.me/PriceAction_ICT
⚜️ JOIN THE VIP 👉 t.me/ArmanShabanTrading
🚀 MondFX — our trusted Broker : bit.ly/MondFx
Pubblicazioni correlate
Declinazione di responsabilità
Le informazioni e le pubblicazioni non sono intese come, e non costituiscono, consulenza o raccomandazioni finanziarie, di investimento, di trading o di altro tipo fornite o approvate da TradingView. Per ulteriori informazioni, consultare i Termini di utilizzo.
📘 Wanna Learn ICT & SMC? Get the Full Book Here : bit.ly/ICT-BOOK
⚜️ Free Telegram Channel : telegram.me/PriceAction_ICT
⚜️ JOIN THE VIP 👉 t.me/ArmanShabanTrading
🚀 MondFX — our trusted Broker : bit.ly/MondFx
⚜️ Free Telegram Channel : telegram.me/PriceAction_ICT
⚜️ JOIN THE VIP 👉 t.me/ArmanShabanTrading
🚀 MondFX — our trusted Broker : bit.ly/MondFx
Pubblicazioni correlate
Declinazione di responsabilità
Le informazioni e le pubblicazioni non sono intese come, e non costituiscono, consulenza o raccomandazioni finanziarie, di investimento, di trading o di altro tipo fornite o approvate da TradingView. Per ulteriori informazioni, consultare i Termini di utilizzo.