
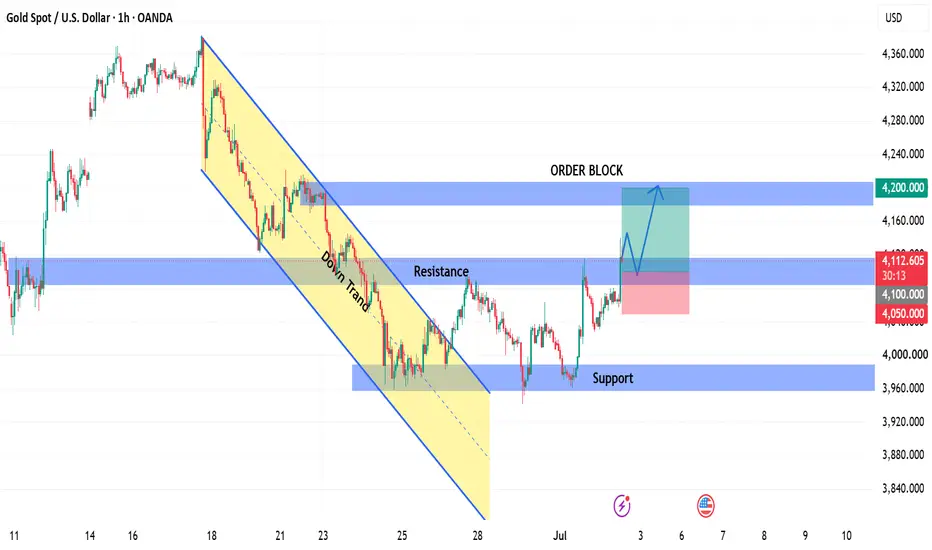
This chart shows that Gold is attempting to reverse after a prolonged bearish trend. The analysis is based on price action, trend structure, support/resistance, and order block concepts.
1. Previous Downtrend Channel
The highlighted descending channel shows that price was making lower highs and lower lows, confirming a bearish market structure.
Sellers remained in control until price reached the support zone around 3960.
2. Strong Support Zone
The blue zone near 3960 acted as a major support area.
Buyers stepped in aggressively from this level, creating a bullish reaction and preventing further downside.
This indicates that demand was stronger than selling pressure in that region.
3. Break Above Resistance
Price has now rallied back toward the 4100–4120 resistance zone.
A successful move above this resistance would suggest that buyers are gaining momentum and the previous bearish structure is weakening.
4. Order Block as Next Target
The highlighted Order Block around 4200 represents an area where institutional selling previously occurred.
If price breaks and holds above the current resistance, this zone becomes the next logical area where price could react.
5. Trade Idea (Example)
Entry Area: Around 4110–4120 after a confirmed bullish breakout or a successful retest of resistance as support.
Stop Loss: Around 4050, below the recent swing low to reduce the risk of a false breakout.
Potential Target: Around 4200, which aligns with the identified order block.
6. What to Watch
✅ A strong bullish candle closing above 4120 would increase the probability of continuation toward 4200.
⚠️ If price fails to hold above the resistance and forms bearish rejection candles, it could pull back toward 4050 or even revisit the 3960 support before choosing a new direction.
Conclusion
The overall short-term bias is becoming bullish, but confirmation is still important. Traders should wait for a clean breakout and retest rather than entering before resistance is cleared. Managing risk with appropriate stop-loss placement remains essential, as no technical setup guarantees future price movement.
1. Previous Downtrend Channel
The highlighted descending channel shows that price was making lower highs and lower lows, confirming a bearish market structure.
Sellers remained in control until price reached the support zone around 3960.
2. Strong Support Zone
The blue zone near 3960 acted as a major support area.
Buyers stepped in aggressively from this level, creating a bullish reaction and preventing further downside.
This indicates that demand was stronger than selling pressure in that region.
3. Break Above Resistance
Price has now rallied back toward the 4100–4120 resistance zone.
A successful move above this resistance would suggest that buyers are gaining momentum and the previous bearish structure is weakening.
4. Order Block as Next Target
The highlighted Order Block around 4200 represents an area where institutional selling previously occurred.
If price breaks and holds above the current resistance, this zone becomes the next logical area where price could react.
5. Trade Idea (Example)
Entry Area: Around 4110–4120 after a confirmed bullish breakout or a successful retest of resistance as support.
Stop Loss: Around 4050, below the recent swing low to reduce the risk of a false breakout.
Potential Target: Around 4200, which aligns with the identified order block.
6. What to Watch
✅ A strong bullish candle closing above 4120 would increase the probability of continuation toward 4200.
⚠️ If price fails to hold above the resistance and forms bearish rejection candles, it could pull back toward 4050 or even revisit the 3960 support before choosing a new direction.
Conclusion
The overall short-term bias is becoming bullish, but confirmation is still important. Traders should wait for a clean breakout and retest rather than entering before resistance is cleared. Managing risk with appropriate stop-loss placement remains essential, as no technical setup guarantees future price movement.

Join my Telegram for daily Forex & XAUUSD trading signals and market insights: t.me/ApexMarketExpert11
Pubblicazioni correlate
Declinazione di responsabilità
Le informazioni e le pubblicazioni non sono intese come, e non costituiscono, consulenza o raccomandazioni finanziarie, di investimento, di trading o di altro tipo fornite o approvate da TradingView. Per ulteriori informazioni, consultare i Termini di utilizzo.
Join my Telegram for daily Forex & XAUUSD trading signals and market insights: t.me/ApexMarketExpert11
Pubblicazioni correlate
Declinazione di responsabilità
Le informazioni e le pubblicazioni non sono intese come, e non costituiscono, consulenza o raccomandazioni finanziarie, di investimento, di trading o di altro tipo fornite o approvate da TradingView. Per ulteriori informazioni, consultare i Termini di utilizzo.