
Gold May Recover First, but the Medium-Term Structure Still Favours Further Decline
Gold may still show a recovery bounce from current levels, but the broader structure continues to point lower. Even if price rebounds in the short term, the market is still facing medium-term corrective pressure as expectations for tighter monetary policy from major central banks continue to rise, while spot crude oil in the Middle East has surged towards the 150 USD area, keeping inflation risks elevated.
The key question now is not whether gold can recover briefly, but whether that rebound will only create a better selling opportunity before the market continues into the next bearish leg.
Fundamental backdrop
The macro environment remains difficult for gold in the medium term.
Rising expectations for further rate tightening from major central banks are keeping real yield pressure elevated, which reduces the attractiveness of non-yielding assets like gold. At the same time, the sharp rise in crude oil prices is increasing inflation concerns, but it is also reinforcing the likelihood that policymakers may need to remain restrictive for longer.
This combination creates a mixed background in the short term, but from a broader perspective it still favours correction rather than a clean bullish continuation in gold.
Technical structure on H4
Overall structure
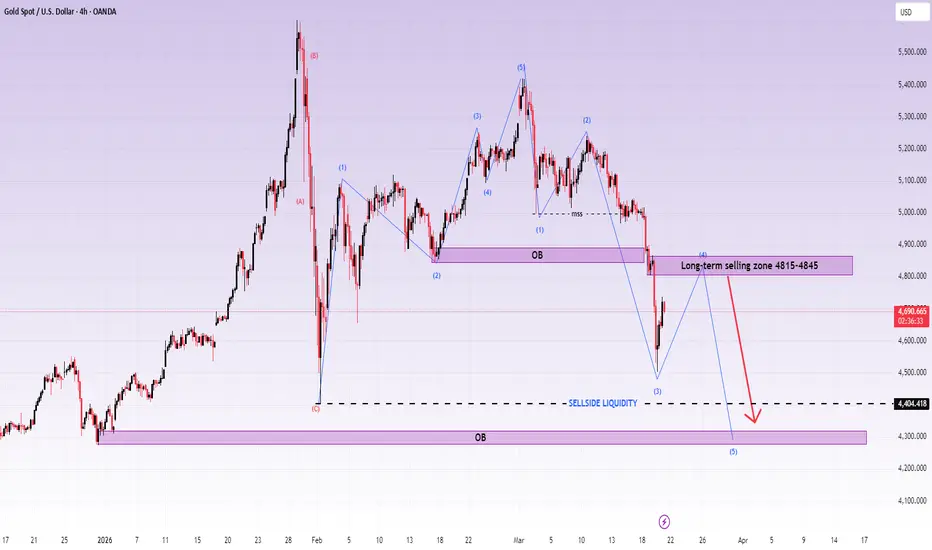
On the H4 chart, XAUUSD remains inside a broader bearish corrective phase despite the recent reaction from lower levels. The current rebound does not yet change the larger structure, because price is still trading below the major long-term selling zone at 4815–4845 and below the previous breakdown structure.
The chart also suggests that the market may still be unfolding a larger bearish sequence, with the current rebound potentially acting as a temporary recovery before the next downside extension.
4815–4845: Long-term selling zone
The 4815–4845 area is the most important resistance zone in the current structure.
This is the main zone where price may complete a recovery leg and attract renewed selling pressure. If gold rebounds into this area but fails to reclaim it with strong momentum, the market may begin the next medium-term decline from here.
From a structure perspective, this is the most reasonable area to wait for a sell setup rather than chasing the current move lower.
4404: Sellside liquidity target
Below the market, the 4404 area stands out as the main sellside liquidity level.
This zone is important because it represents the next major downside objective if the broader bearish structure continues to unfold. A move into this area would also fit the idea of the market extending into a larger wave 5 decline.
4300 area: Deeper OB support
If bearish momentum expands further, the next major reaction zone comes in around the 4300 OB area.
This is the deeper support zone on the chart and the region where a stronger reaction from buyers may appear if the correction becomes more aggressive.
What the wave structure is suggesting
The current structure supports the idea that gold may still be preparing for another leg lower in the medium term.
The recent rebound looks more like a corrective recovery than the beginning of a new bullish cycle. If price continues to recover into the 4815–4845 resistance zone and then gets rejected, that could become the trigger for the next broader decline, with the market potentially extending into a wave 5 move lower.
So for now:
the broader trend remains under corrective bearish pressure
the current rebound may only be temporary
and the preferred strategy is still to wait for a better sell zone rather than buying into resistance
Trading scenarios
Scenario 1: Recovery into sell zone, then bearish continuation
If gold continues to recover towards 4815–4845 and shows clear rejection, the market may resume its medium-term decline from this area.
Entry: 4815–4845 on bearish confirmation
SL: above 4870
TP1: 4680
TP2: 4500
TP3: 4404
TP4: 4300
This remains the preferred setup, as it aligns with the broader bearish structure and the expectation of a larger wave 5 extension.
Scenario 2: Direct continuation lower without deeper rebound
If gold fails to recover into the higher resistance zone and remains weak below current structure resistance, sellers may continue pressing price lower directly.
Entry: on bearish continuation below the recent recovery structure
SL: above the local swing high
TP1: 4500
TP2: 4404
TP3: 4300
Scenario 3: Bullish invalidation
If price breaks above 4845 and holds firmly above the long-term selling zone, the bearish medium-term view would weaken significantly.
That would suggest the market is no longer in a simple corrective rebound and may need a broader re-evaluation.
Key levels to watch
4815–4845 → long-term selling zone
4680 → first downside reaction level
4500 → intermediate bearish target
4404 → major sellside liquidity
4300 → deeper OB support zone
Conclusion
Gold may still recover in the short term, but the broader H4 structure continues to favour a medium-term decline. The current rebound is more likely to be a corrective move rather than the start of a sustained bullish reversal.
For Lana, the preferred approach is clear: wait for a reasonable sell zone, not chase price at the bottom. As long as gold remains below 4815–4845, the market still has room to extend lower, with 4404 and then 4300 remaining the key downside targets in a potential wave 5 scenario.
Follow Lana for more XAUUSD trading ideas and clear technical setups.
Gold may still show a recovery bounce from current levels, but the broader structure continues to point lower. Even if price rebounds in the short term, the market is still facing medium-term corrective pressure as expectations for tighter monetary policy from major central banks continue to rise, while spot crude oil in the Middle East has surged towards the 150 USD area, keeping inflation risks elevated.
The key question now is not whether gold can recover briefly, but whether that rebound will only create a better selling opportunity before the market continues into the next bearish leg.
Fundamental backdrop
The macro environment remains difficult for gold in the medium term.
Rising expectations for further rate tightening from major central banks are keeping real yield pressure elevated, which reduces the attractiveness of non-yielding assets like gold. At the same time, the sharp rise in crude oil prices is increasing inflation concerns, but it is also reinforcing the likelihood that policymakers may need to remain restrictive for longer.
This combination creates a mixed background in the short term, but from a broader perspective it still favours correction rather than a clean bullish continuation in gold.
Technical structure on H4
Overall structure
On the H4 chart, XAUUSD remains inside a broader bearish corrective phase despite the recent reaction from lower levels. The current rebound does not yet change the larger structure, because price is still trading below the major long-term selling zone at 4815–4845 and below the previous breakdown structure.
The chart also suggests that the market may still be unfolding a larger bearish sequence, with the current rebound potentially acting as a temporary recovery before the next downside extension.
4815–4845: Long-term selling zone
The 4815–4845 area is the most important resistance zone in the current structure.
This is the main zone where price may complete a recovery leg and attract renewed selling pressure. If gold rebounds into this area but fails to reclaim it with strong momentum, the market may begin the next medium-term decline from here.
From a structure perspective, this is the most reasonable area to wait for a sell setup rather than chasing the current move lower.
4404: Sellside liquidity target
Below the market, the 4404 area stands out as the main sellside liquidity level.
This zone is important because it represents the next major downside objective if the broader bearish structure continues to unfold. A move into this area would also fit the idea of the market extending into a larger wave 5 decline.
4300 area: Deeper OB support
If bearish momentum expands further, the next major reaction zone comes in around the 4300 OB area.
This is the deeper support zone on the chart and the region where a stronger reaction from buyers may appear if the correction becomes more aggressive.
What the wave structure is suggesting
The current structure supports the idea that gold may still be preparing for another leg lower in the medium term.
The recent rebound looks more like a corrective recovery than the beginning of a new bullish cycle. If price continues to recover into the 4815–4845 resistance zone and then gets rejected, that could become the trigger for the next broader decline, with the market potentially extending into a wave 5 move lower.
So for now:
the broader trend remains under corrective bearish pressure
the current rebound may only be temporary
and the preferred strategy is still to wait for a better sell zone rather than buying into resistance
Trading scenarios
Scenario 1: Recovery into sell zone, then bearish continuation
If gold continues to recover towards 4815–4845 and shows clear rejection, the market may resume its medium-term decline from this area.
Entry: 4815–4845 on bearish confirmation
SL: above 4870
TP1: 4680
TP2: 4500
TP3: 4404
TP4: 4300
This remains the preferred setup, as it aligns with the broader bearish structure and the expectation of a larger wave 5 extension.
Scenario 2: Direct continuation lower without deeper rebound
If gold fails to recover into the higher resistance zone and remains weak below current structure resistance, sellers may continue pressing price lower directly.
Entry: on bearish continuation below the recent recovery structure
SL: above the local swing high
TP1: 4500
TP2: 4404
TP3: 4300
Scenario 3: Bullish invalidation
If price breaks above 4845 and holds firmly above the long-term selling zone, the bearish medium-term view would weaken significantly.
That would suggest the market is no longer in a simple corrective rebound and may need a broader re-evaluation.
Key levels to watch
4815–4845 → long-term selling zone
4680 → first downside reaction level
4500 → intermediate bearish target
4404 → major sellside liquidity
4300 → deeper OB support zone
Conclusion
Gold may still recover in the short term, but the broader H4 structure continues to favour a medium-term decline. The current rebound is more likely to be a corrective move rather than the start of a sustained bullish reversal.
For Lana, the preferred approach is clear: wait for a reasonable sell zone, not chase price at the bottom. As long as gold remains below 4815–4845, the market still has room to extend lower, with 4404 and then 4300 remaining the key downside targets in a potential wave 5 scenario.
Follow Lana for more XAUUSD trading ideas and clear technical setups.
Trade attivo
Wave 5 of the bearish trend is beginning, the price structure is correct. The current entry point is to wait for a price correction at the start of the new trading week before placing an order.

Pubblicazioni correlate
Declinazione di responsabilità
Le informazioni e le pubblicazioni non sono intese come, e non costituiscono, consulenza o raccomandazioni finanziarie, di investimento, di trading o di altro tipo fornite o approvate da TradingView. Per ulteriori informazioni, consultare i Termini di utilizzo.
Pubblicazioni correlate
Declinazione di responsabilità
Le informazioni e le pubblicazioni non sono intese come, e non costituiscono, consulenza o raccomandazioni finanziarie, di investimento, di trading o di altro tipo fornite o approvate da TradingView. Per ulteriori informazioni, consultare i Termini di utilizzo.