
1. Market Structure & Context
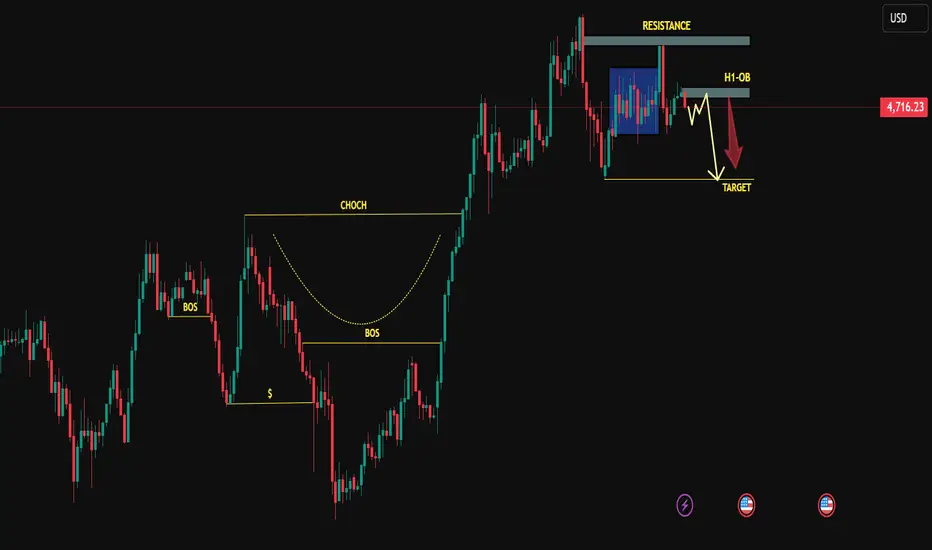
The chart displays a transition from a bullish trend to a potential bearish reversal.
BOS (Break of Structure): Earlier bullish momentum is evident through the "BOS" labels on the left, showing the market making higher highs.
CHOCH (Change of Character): The price reached a peak and failed to sustain higher levels, marked by the CHOCH line. This indicates a shift in market sentiment from bullish to bearish.
2. Supply and Resistance Zones
The price is currently reacting to a dual-layered supply area:
Major Resistance: A broad grey zone at the top which halted the previous aggressive rally.
H1-OB (1-Hour Order Block): A more refined area of interest where institutional selling likely occurred. Price has returned to "mitigate" this block, creating a high-probability entry point for shorts.
3. Price Action & Execution
The analysis anticipates a distribution phase:
Consolidation: The price is currently hovering just below the H1-OB, consolidating after the initial rejection.
The Path: The yellow zig-zag line suggests a minor corrective bounce or "fake-out" into the Order Block before the primary move downward.
Target: The immediate downside target is the previous swing low (marked with the yellow horizontal line), representing a liquidity grab below recent support.
The chart displays a transition from a bullish trend to a potential bearish reversal.
BOS (Break of Structure): Earlier bullish momentum is evident through the "BOS" labels on the left, showing the market making higher highs.
CHOCH (Change of Character): The price reached a peak and failed to sustain higher levels, marked by the CHOCH line. This indicates a shift in market sentiment from bullish to bearish.
2. Supply and Resistance Zones
The price is currently reacting to a dual-layered supply area:
Major Resistance: A broad grey zone at the top which halted the previous aggressive rally.
H1-OB (1-Hour Order Block): A more refined area of interest where institutional selling likely occurred. Price has returned to "mitigate" this block, creating a high-probability entry point for shorts.
3. Price Action & Execution
The analysis anticipates a distribution phase:
Consolidation: The price is currently hovering just below the H1-OB, consolidating after the initial rejection.
The Path: The yellow zig-zag line suggests a minor corrective bounce or "fake-out" into the Order Block before the primary move downward.
Target: The immediate downside target is the previous swing low (marked with the yellow horizontal line), representing a liquidity grab below recent support.
Trade chiuso: obiettivo raggiunto
XAUUSD full target achieved — now running 400+ pips in my direction 📈🔥
📊 Professional Forex & Gold Analyst | Trading pure price action and high-probability market structure. Daily 4–5 quality trade setups with disciplined risk management. Join: t.me/+NJDp2aIM3QphYWNk| Contact: @fx_martin9
Declinazione di responsabilità
Le informazioni e le pubblicazioni non sono intese come, e non costituiscono, consulenza o raccomandazioni finanziarie, di investimento, di trading o di altro tipo fornite o approvate da TradingView. Per ulteriori informazioni, consultare i Termini di utilizzo.
📊 Professional Forex & Gold Analyst | Trading pure price action and high-probability market structure. Daily 4–5 quality trade setups with disciplined risk management. Join: t.me/+NJDp2aIM3QphYWNk| Contact: @fx_martin9
Declinazione di responsabilità
Le informazioni e le pubblicazioni non sono intese come, e non costituiscono, consulenza o raccomandazioni finanziarie, di investimento, di trading o di altro tipo fornite o approvate da TradingView. Per ulteriori informazioni, consultare i Termini di utilizzo.