
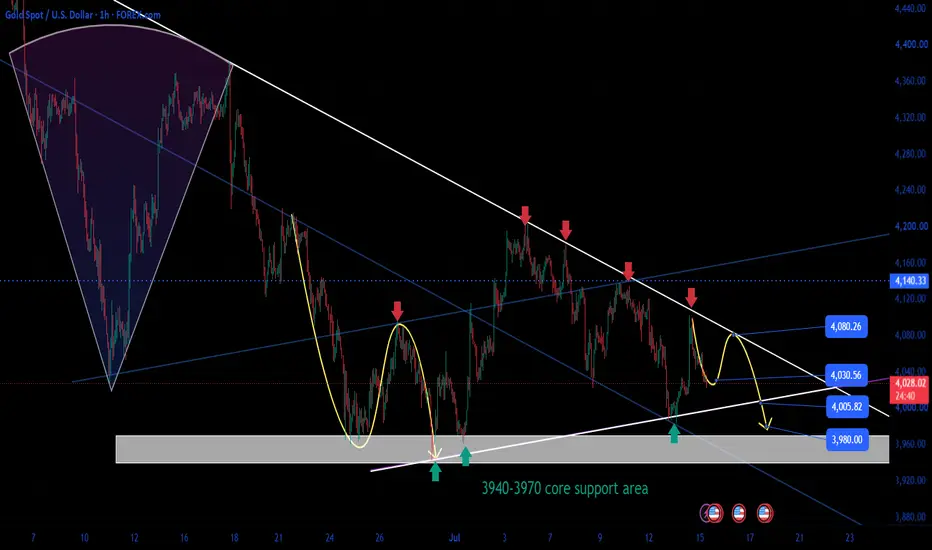
Buy gold first, then short gold.
290+ PIPS Profit Secured | Range Trading Continues 🚀
Dear fellow traders, good morning! ☀️🙏
In yesterday’s analysis, we identified:
🔥 4090-4100 USD
as the key resistance zone for short positions.
During the live market session, we provided the sell signal:
📌 4090-4095 USD Short Entry
Gold moved lower as expected and reached:
🎯 4050-4060 USD Support Zone
When bearish momentum slowed near support, we closed the position and secured:
💰 290+ PIPS profit ✅
Congratulations to all traders who followed our strategy! 👏
Successful trading comes from:
✅ Clear analysis
✅ Patience and discipline
✅ Strict risk management
🌎 Fundamental Analysis | Market Outlook 🔍
On Wednesday, July 15, gold opened slightly weaker.
The price was affected by:
📉 Previous session’s late pullback pressure
🌍 Rising geopolitical risks
🛢️ Stronger oil prices
Although recent inflation data showed signs of cooling, the impact may be limited.
As long as:
⚠️ Geopolitical risks remain
⚠️ Oil prices stay elevated
gold may continue facing pressure.
Therefore, today’s market may remain:
📊 Range-bound with both long and short opportunities.
📌 Key Economic Events Today
The market will focus on:
🇺🇸 US June PPI data (YoY & MoM)
Based on yesterday’s CPI data and market expectations:
📉 Further inflation cooling is possible,
which could reduce rate pressure and support gold.
However:
📈 Stronger New York Fed manufacturing expectations
🛢️ Oil price movements
🌍 Geopolitical uncertainty
may limit gold’s rebound.
Current approach:
➡️ Buy first, then look for selling opportunities at resistance.
📈 Gold Technical Analysis
The overall gold structure remains:
📉 Weak consolidation
There is still no clear signal of a major bullish reversal.
The most important level to watch:
🔥 4200 USD
Remember:
As long as gold cannot break and hold above 4200:
➡️ All rebounds below this level should be considered technical recoveries.
However, there is no need to become overly bearish.
The key support remains:
🟢 3940 USD
As long as this level holds:
➡️ Bulls still have opportunities to recover.
The market currently needs a catalyst to choose the next direction.
📊 Technical Structure | Daily & 4H Chart
Tuesday’s daily candle closed higher.
The Bollinger Bands are narrowing:
➡️ Market volatility is decreasing.
However:
Gold has not yet stabilized above the 4H Bollinger middle band.
This shows:
⚠️ Bullish momentum is not strong enough yet.
Current trading range:
🔥 4000-4100 USD
Before the range breaks:
📌 Focus on short-term range trading.
Trade:
⬆️ Sell near resistance
⬇️ Buy near support
Only after a clear breakout:
➡️ Follow the larger trend.
🔑 Important Levels Today
🔴 Resistance:
🔥 4050-4060 USD
🔥 4100 USD
🔥 4200 USD (Major trend level)
🟢 Support:
🔥 4000 USD
🔥 3980-3970 USD
🔥 3940 USD (Key support)
🎯 Gold Trading Strategy | July 15
🔻 Short Setup:
Entry:
🔥 4050-4060 USD
Stop Loss:
🛑 4080 USD
Targets:
🎯 4000 USD
🎯 3980 USD
🟢 Long Setup:
Entry:
🔥 3980-3970 USD
Stop Loss:
🛑 3960 USD
Targets:
🎯 4020-4030 USD
📌 Market Summary
Current gold market:
➡️ Short-term: Range consolidation
➡️ Above 4200: Bullish trend confirmation
➡️ Below 3940: Bearish pressure increases
The key factors remain:
🌍 Geopolitical developments
🏦 Fed policy direction
💵 Dollar movement
Do not force a single direction before the market chooses.
Trade the levels, control risk, and wait patiently. 📊
💬 Community Discussion
Dear traders, what is your view on gold today? 🤔
1️⃣ Will gold break above 4100 and challenge 4200? 📈
2️⃣ Or will resistance push price back toward 4000? 📉
Share your analysis below 👇
👍 Like for support
🔔 Follow for daily gold analysis
💬 Comment your trading plan
Wishing everyone:
💰 Profitable Trading
📈 Consistent Results
🏆 Successful Trading Day! 🚀
Trade attivo
🟡 Gold Market Analysis | July 16 📊
Perfect Technical Structure Confirmation | 250+ PIPS Profit Secured 🚀
The market once again confirmed our previous technical analysis.
The chart structure we identified matched the price movement perfectly:
📌 First: Buy gold from the support area
📌 Then: Sell gold near resistance
The market followed our expected path:
🔥 Gold faced rejection near 4080 USD
📉 Then declined toward 4030 USD for consolidation
📉 Today, price moved again toward the key support zone:
🎯 3940-3970 USD
During the live market session, we publicly shared:
📌 4030-4035 USD Buy Signal
Gold rebounded as expected and we closed the position near:
🎯 4060 USD
Securing:
💰 250+ PIPS profit ✅
Congratulations to all traders who followed our strategy! 👏👏
📈 Gold Technical Analysis | Daily Chart
From the daily structure:
Gold has shown signs of technical stabilization.
At the same time:
💵 Dollar weakness has created conditions for a rebound.
However:
Gold has closed higher for two consecutive days but has not yet recovered above the moving average zone.
This shows:
⚠️ The bullish recovery is not strong enough yet.
Key resistance levels:
🔴 First resistance:
4055 USD (5-day MA)
🔴 Major resistance:
🔥 4083-4092 USD
As long as gold cannot break and hold above this area:
➡️ The overall technical structure remains bearish.
Meanwhile, geopolitical factors remain important.
The reason gold has not strongly followed dollar weakness may be related to:
🌍 Ongoing US-Iran tensions.
For a stronger gold recovery:
⚠️ A clear improvement in geopolitical conditions may be needed.
📊 Short-Term Technical Outlook | H1 Chart
Yesterday gold mainly traded within:
🔥 4080-4020 USD range
Market movement was influenced by:
📌 Technical factors
📌 Fundamental news events
The current structure suggests a short-term consolidation range.
🔑 Important Levels Today
🔴 Resistance:
🔥 4055 USD
🔥 4075-4080 USD
🔥 4095-4100 USD
🟢 Support:
🔥 4020-4015 USD
🔥 3980 USD
🔥 3960-3950 USD
🎯 Gold Trading Strategy | July 16
Current strategy:
📉 Sell rebounds
🔻 Short Setup:
First Entry:
🔥 4030-4040 USD
If gold breaks above this area:
Do not enter the market if gold prices rise sharply and break through this area:
And look for short trading opportunities at the strong resistance level of 4050-4060USD
Stop Loss:
🛑 4075 USD
Targets:
🎯 4020-4000 USD
Break below:
➡️ Hold for:
🎯 3950-3980 USD
📌 Market Summary
Current gold outlook:
➡️ Short-term: Technical rebound within a weak structure
➡️ Resistance remains effective below 4100
➡️ Support zone 3940-3970 remains critical
💬 Community Discussion
Dear traders, what is your expectation for gold today? 🤔
1️⃣ Can gold break above 4080-4100 resistance? 📈
2️⃣ Or will sellers continue controlling the market? 📉
Share your analysis below 👇
👍 Like for support
🔔 Follow for daily gold analysis
💬 Comment your trading idea
Wishing everyone:
💰 Profitable Trading
📈 Consistent Results
🏆 Another Successful Trading Day! 🚀
Trade chiuso: obiettivo raggiunto
🟡 Gold Trading Review & July 17 Market Analysis
3982-3985 Long Position Perfectly Executed | 210+ PIPS Profit Secured 🎯
Yesterday during the US session, we provided a real-time trading opportunity based on the key support zone:
📌 Gold Buy Entry: 3982-3985 USD
Although gold was still in a short-term downtrend and rebound momentum was relatively weak, we identified:
🔥 3970 USD as a strong support area
Our trading logic was clear:
If gold could hold this support zone and successfully reclaim the 4000 psychological level, the upside recovery could extend toward:
🎯 4020-4030 USD
With a favorable risk-to-reward ratio, we confidently executed the long setup.
As expected:
📈 Gold rebounded during the Asian session and reached:
🎯 4008 USD
The market once again followed our trading plan perfectly.
Congratulations to all traders who followed the signal! 👏👏
💰 Profit secured: 210+ PIPS ✅
Successful trading is never about guessing the market.
It comes from:
✅ Clear market structure
✅ Precise entry levels
✅ Strict risk management
✅ Patience and discipline
🌍 Fundamental Analysis | Gold Market Outlook
On July 17, during the Asian session, spot gold moved lower and touched a two-week low.
The recent decline in gold has been driven by multiple factors:
📌 Rising geopolitical tensions in the Middle East
📌 Stronger US Dollar
📌 Higher US Treasury yields
📌 Increasing expectations for higher interest rates
📌 Reduced demand for non-yielding assets
The escalation of tensions in the Middle East has pushed oil prices higher, increasing inflation concerns.
Meanwhile, stronger-than-expected US economic data has reinforced expectations that the Federal Reserve may maintain a restrictive monetary policy for longer.
These factors have created short-term pressure on gold.
However, from a medium-to-long-term perspective:
🌍 Global central bank gold purchases
🌍 Geopolitical uncertainty
🌍 Long-term inflation risks
continue to provide fundamental support for gold.
Therefore, the current move should be viewed as:
📊 A correction phase rather than a complete change in the long-term trend.
Traders should continue monitoring:
🔥 US Dollar movement
🔥 Federal Reserve policy signals
🔥 Middle East geopolitical developments
🔥 Energy market volatility
These factors will determine gold’s next major direction.
📈 Gold Technical Analysis
Daily Chart Analysis
Yesterday gold formed a strong bearish candle:
📉 Broke below the 4000 psychological level
📉 Broke below the previous consolidation support zone
Short-term moving averages:
5-day, 10-day, and 20-day MA are showing a bearish alignment.
Technical indicators:
📉 MACD bearish momentum continues expanding.
📉 RSI has dropped near 30, entering oversold territory.
However, there is no clear bullish divergence yet.
The current daily structure shows:
📉 A potential small rounding top formation.
Key support area:
🟢 3940-3960 USD
If this zone fails:
Next target:
🎯 3920 USD
📊 4-Hour Chart Analysis
Gold is currently trading inside a descending channel.
Current characteristics:
📌 Lower highs continue forming
📌 Every rebound faces selling pressure
📌 Bearish structure remains intact
Price is approaching the lower boundary of the channel.
A short-term technical rebound is possible.
However, unless gold breaks key resistance levels:
➡️ Any rebound should still be treated as a corrective move.
⏱ 1-Hour Chart Analysis
The Bollinger Bands continue opening downward.
Gold is trading near the lower band.
Short-term resistance:
🔴 4000-4015 USD
If price breaks above:
Next resistance:
🔥 4030-4040 USD
If resistance holds:
Gold may continue testing:
🟢 3960 USD
and
🟢 3920-3930 USD
🔥 Gold Trading Strategy | July 17
Current market view:
📉 Main trend: Bearish
📈 Short-term: Possible technical rebound
Trading approach:
Sell rebounds as the main strategy, buy dips as a secondary strategy.
📌 Gold Trading Plan
🔻 Short Strategy:
Sell zone:
🔥 4030-4050 USD
Entry condition:
Look for rejection signals near resistance.
Stop Loss:
🛑 4075 USD
Targets:
🎯 3980-3960 USD
Break below:
➡️ Hold for:
🎯 3940 USD
🟢 Long Opportunity:
If gold falls toward:
🔥 3960-3980 USD
and shows stabilization signals,
short-term buying opportunities can be considered.
💬 Market Discussion
Dear traders, what is your expectation for gold today? 🤔
1️⃣ Can gold hold the 3960 support zone and start a rebound? 📈
2️⃣ Or will sellers continue pushing gold toward 3940 and lower? 📉
Share your analysis in the comments below 👇
👍 Like for support
⭐ Follow for daily gold market updates
🔔 Stay tuned for real-time trading opportunities
Wishing everyone:
💰 Profitable Trading
📈 Consistent Results
🚀 Another successful trading day!

Pubblicazioni correlate
Declinazione di responsabilità
Le informazioni e le pubblicazioni non sono intese come, e non costituiscono, consulenza o raccomandazioni finanziarie, di investimento, di trading o di altro tipo fornite o approvate da TradingView. Per ulteriori informazioni, consultare i Termini di utilizzo.
Pubblicazioni correlate
Declinazione di responsabilità
Le informazioni e le pubblicazioni non sono intese come, e non costituiscono, consulenza o raccomandazioni finanziarie, di investimento, di trading o di altro tipo fornite o approvate da TradingView. Per ulteriori informazioni, consultare i Termini di utilizzo.