
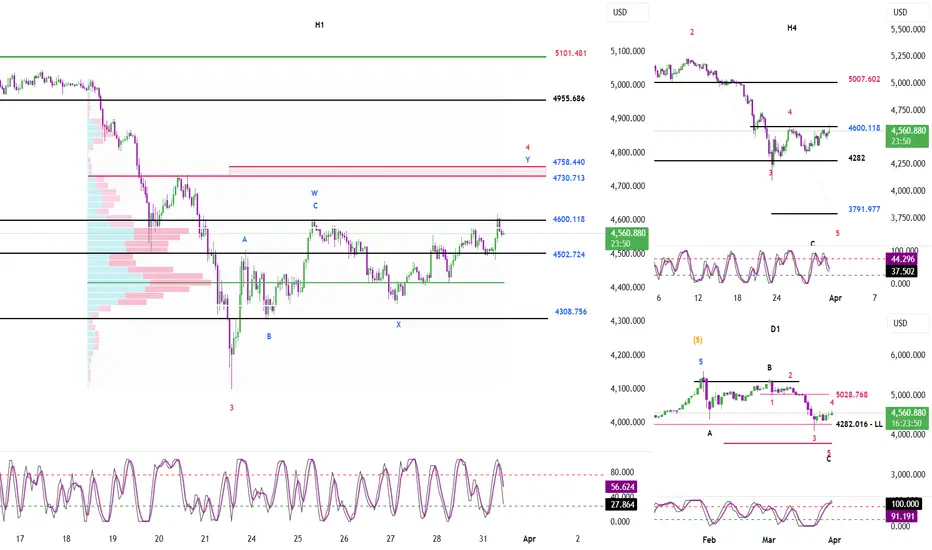
Momentum
– D1 momentum has not confirmed a reversal yet
→ Price is likely to continue moving sideways or upward
→ Until a clear reversal signal appears
– H4 momentum is decreasing
→ It may take another 1–2 H4 candles to reach the oversold zone
→ At that point, a potential H4 bottom may form
– H1 momentum is decreasing
→ Price may continue to decline or move sideways downward
→ Until H1 reaches the oversold zone and reverses upward
Elliott Wave Structure
– On D1:
→ Since there is no confirmed bearish reversal in momentum
→ Wave 4 is likely still in progress
→ However, it is approaching the final phase
→ After completion, a decline may occur to form Wave 5
– On H4:
→ Wave 4 is developing in a sideways structure
→ Likely forming a WXY pattern or a triangle
→ H4 momentum is showing signs of compression and preparing to reverse
→ A further upward move is likely
→ Price has moved above the 4600 level and broken the previous high
→ This invalidates the scenario of an ongoing Wave 5
→ And confirms that Wave 4 is still extending
– On H1:
→ After reaching the 4600 area, price is showing a reaction
→ The major liquidity zone at 4502 acts as a key support
→ With H4 and H1 momentum preparing to reverse
→ If price approaches this area, a bullish reaction may occur
→ In a WXY correction structure:
→ The target where Wave Y = Wave W is around 4758
→ Combined with a major liquidity zone at 4730
→ This area may mark the completion of Wave Y and Wave 4
Trading Plan
Buy Zone: 4503 – 4501
Stop Loss (SL): 4587
Take Profit 1 (TP1): 4600
Take Profit 2 (TP2): 4730
Trade attivo
The H4 momentum is increasing, so the price is likely to continue rising or move sideways until the momentum enters the overbought zone and shows signs of reversal.
On the H1 timeframe, momentum is also rising and has reached about halfway to the overbought zone. However, the current bullish candles still have small bodies, indicating that the upward momentum is not yet strong or clearly established.
If this condition continues until H1 momentum reaches the overbought zone and the price fails to break above 4600, there is a high probability that the market will form a corrective move following an ABC structure. After that, the price may decline toward the blue liquidity zone to complete wave C.
Trade chiuso: obiettivo raggiunto
H4 momentum is currently in the overbought zone, indicating a high probability of a reversal. As a result, the market may enter a decline or move sideways until H4 reaches the oversold zone.
Meanwhile, H1 momentum is already in the oversold zone and showing signs of a potential reversal. If the H1 reversal is confirmed, it could lead to a broader reversal on H4.

📢 Sometimes signals appear on TradingView with a slight delay!
🚀 Join our Telegram channel to get instant updates and real-time scalping signals:
👉 t.me/+lASNLyXKqcFiYmJl
🚀 Join our Telegram channel to get instant updates and real-time scalping signals:
👉 t.me/+lASNLyXKqcFiYmJl
Pubblicazioni correlate
Declinazione di responsabilità
Le informazioni e le pubblicazioni non sono intese come, e non costituiscono, consulenza o raccomandazioni finanziarie, di investimento, di trading o di altro tipo fornite o approvate da TradingView. Per ulteriori informazioni, consultare i Termini di utilizzo.
📢 Sometimes signals appear on TradingView with a slight delay!
🚀 Join our Telegram channel to get instant updates and real-time scalping signals:
👉 t.me/+lASNLyXKqcFiYmJl
🚀 Join our Telegram channel to get instant updates and real-time scalping signals:
👉 t.me/+lASNLyXKqcFiYmJl
Pubblicazioni correlate
Declinazione di responsabilità
Le informazioni e le pubblicazioni non sono intese come, e non costituiscono, consulenza o raccomandazioni finanziarie, di investimento, di trading o di altro tipo fornite o approvate da TradingView. Per ulteriori informazioni, consultare i Termini di utilizzo.