
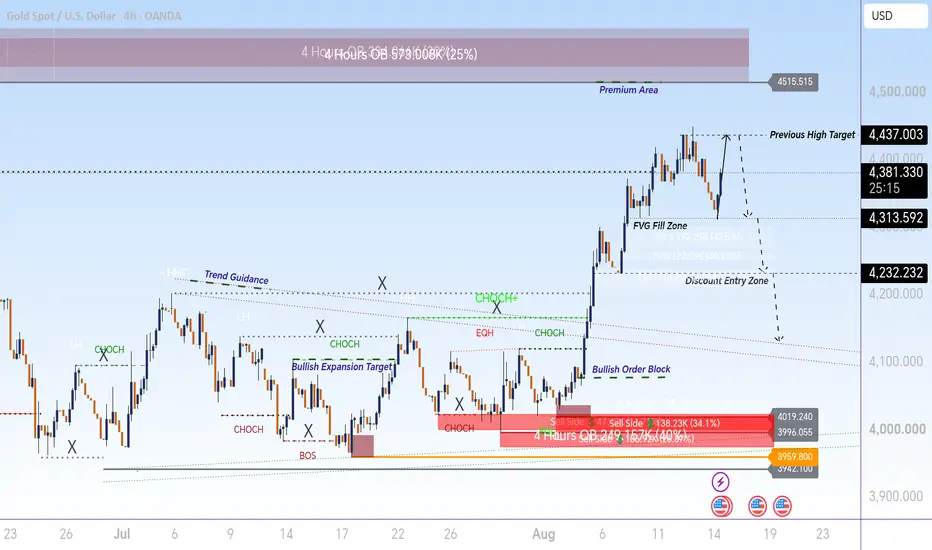
Gold (XAU/USD) Smart Money Concepts | Market Structure & Liquidity Analysis

This advanced Gold (XAU/USD) Smart Money Concepts (SMC) education chart explains how price moves through market structure, liquidity zones, order blocks, fair value gaps (FVG), and institutional trading concepts. Every candle on the chart represents the battle between buyers and sellers, showing where liquidity is collected, where institutions enter, and how market direction changes.
A professional trader does not analyze candles individually only by color. The real meaning comes from candle location, structure, momentum, liquidity, and confirmation.
---
1. Initial Bearish Movement — Seller Control
The first candles show strong selling pressure as sellers dominate the market.
Large Bearish Candles:
These candles indicate aggressive selling. Sellers are pushing price lower because supply is stronger than demand.
Small Pullback Candles:
Temporary bullish candles appear during the decline, showing buyers attempting a recovery, but they fail to break the bearish structure.
Lower High (LH) Formation:
The candles create lower highs, confirming that sellers are defending higher prices.
Reason:
The market remains bearish because sellers continue creating supply and preventing buyers from gaining control.
---
2. Liquidity Formation — Smart Money Preparation
Before a major move, the market often creates liquidity areas.
Equal Highs (EQH):
Multiple candles reaching similar highs create buy-side liquidity above the market.
Equal Lows (EQL):
Repeated lows create sell-side liquidity where stop losses are placed.
Wick Rejection Candles:
Long wicks show price testing liquidity areas and rejecting those levels.
Reason:
Smart money often uses these liquidity pools to collect orders before starting the next expansion.
---
3. CHoCH (Change of Character) — Trend Shift
CHoCH represents the first sign that market control is changing.
Break Above Previous Structure:
A strong bullish candle breaks a previous lower high, showing buyers are becoming stronger.
Confirmation Candles:
Following bullish candles confirm that momentum has shifted.
Retest Candles:
Price may return to the broken structure to test whether buyers are still defending the area.
Reason:
CHoCH shows that the previous trend is losing strength and a new direction may begin.
---
4. BOS (Break of Structure) — Trend Confirmation
BOS confirms continuation after the market shift.
Strong Expansion Candle:
A large bullish candle breaks important resistance, showing institutional buying pressure.
Momentum Candles:
Multiple bullish candles with strong bodies indicate increasing demand.
Pullback Candles:
Small corrections allow the market to collect more liquidity before continuing.
Reason:
BOS confirms that buyers have gained control and the bullish structure is active.
---
5. Bullish Order Block — Institutional Demand Zone
The red demand area represents a potential institutional buying zone.
Last Bearish Candle Before Rally:
This candle represents the final selling pressure before buyers take control.
Strong Bullish Reaction Candles:
Price leaves the zone with momentum, indicating strong demand.
Retest Candles:
When price returns to the order block, traders observe whether buyers defend the area.
Reason:
Institutions often place large positions around these zones, creating strong reactions.
---
6. Fair Value Gap (FVG) — Price Imbalance
FVG appears when price moves aggressively and leaves an imbalance.
Large Momentum Candles:
Fast movement creates a gap between buyers and sellers.
Return Candles:
Price often revisits this area to fill the imbalance.
Reaction Candle:
A strong rejection after filling FVG shows continuation.
Reason:
Markets often seek balance before continuing the main move.
---
7. Liquidity Sweep — Stop Hunt Concept
Before expansion, price may collect liquidity.
Sharp Wick Candle:
A candle moves beyond a key level and quickly returns, trapping traders.
Rejection Candle:
Shows that the breakout was not genuine.
Strong Opposite Candle:
Confirms that smart money has completed liquidity collection.
Reason:
Liquidity sweeps allow institutions to enter positions with available orders.
---
8. Current Price Action — Gold Expansion Scenario
The latest candles show bullish strength after a structural shift.
Higher High Candles:
Indicate buyers are successfully pushing price upward.
Higher Low Candles:
Show that buyers are protecting pullback areas.
Momentum Candles Near Highs:
Indicate strong demand but require confirmation near resistance.
Reason:
The market is attempting continuation while respecting important liquidity and supply zones.
---
Complete Candle Reading Lesson
Every candle explains:
Who controls the market
Where liquidity is located
Where institutions may enter
Where trend changes happen
Where price may react
This chart teaches:
Market Structure
CHoCH & BOS
Liquidity Concepts
Order Blocks
Fair Value Gaps
Supply & Demand
Institutional Price Action
A candle is not just movement — it is the footprint of market psychology. Professional traders learn to read the reason behind every candle before making decisions.
Educational Purpose: This chart is created to understand Gold (XAU/USD) Smart Money Concepts and professional market analysis.
This advanced Gold (XAU/USD) Smart Money Concepts (SMC) education chart explains how price moves through market structure, liquidity zones, order blocks, fair value gaps (FVG), and institutional trading concepts. Every candle on the chart represents the battle between buyers and sellers, showing where liquidity is collected, where institutions enter, and how market direction changes.
A professional trader does not analyze candles individually only by color. The real meaning comes from candle location, structure, momentum, liquidity, and confirmation.
---
1. Initial Bearish Movement — Seller Control
The first candles show strong selling pressure as sellers dominate the market.
Large Bearish Candles:
These candles indicate aggressive selling. Sellers are pushing price lower because supply is stronger than demand.
Small Pullback Candles:
Temporary bullish candles appear during the decline, showing buyers attempting a recovery, but they fail to break the bearish structure.
Lower High (LH) Formation:
The candles create lower highs, confirming that sellers are defending higher prices.
Reason:
The market remains bearish because sellers continue creating supply and preventing buyers from gaining control.
---
2. Liquidity Formation — Smart Money Preparation
Before a major move, the market often creates liquidity areas.
Equal Highs (EQH):
Multiple candles reaching similar highs create buy-side liquidity above the market.
Equal Lows (EQL):
Repeated lows create sell-side liquidity where stop losses are placed.
Wick Rejection Candles:
Long wicks show price testing liquidity areas and rejecting those levels.
Reason:
Smart money often uses these liquidity pools to collect orders before starting the next expansion.
---
3. CHoCH (Change of Character) — Trend Shift
CHoCH represents the first sign that market control is changing.
Break Above Previous Structure:
A strong bullish candle breaks a previous lower high, showing buyers are becoming stronger.
Confirmation Candles:
Following bullish candles confirm that momentum has shifted.
Retest Candles:
Price may return to the broken structure to test whether buyers are still defending the area.
Reason:
CHoCH shows that the previous trend is losing strength and a new direction may begin.
---
4. BOS (Break of Structure) — Trend Confirmation
BOS confirms continuation after the market shift.
Strong Expansion Candle:
A large bullish candle breaks important resistance, showing institutional buying pressure.
Momentum Candles:
Multiple bullish candles with strong bodies indicate increasing demand.
Pullback Candles:
Small corrections allow the market to collect more liquidity before continuing.
Reason:
BOS confirms that buyers have gained control and the bullish structure is active.
---
5. Bullish Order Block — Institutional Demand Zone
The red demand area represents a potential institutional buying zone.
Last Bearish Candle Before Rally:
This candle represents the final selling pressure before buyers take control.
Strong Bullish Reaction Candles:
Price leaves the zone with momentum, indicating strong demand.
Retest Candles:
When price returns to the order block, traders observe whether buyers defend the area.
Reason:
Institutions often place large positions around these zones, creating strong reactions.
---
6. Fair Value Gap (FVG) — Price Imbalance
FVG appears when price moves aggressively and leaves an imbalance.
Large Momentum Candles:
Fast movement creates a gap between buyers and sellers.
Return Candles:
Price often revisits this area to fill the imbalance.
Reaction Candle:
A strong rejection after filling FVG shows continuation.
Reason:
Markets often seek balance before continuing the main move.
---
7. Liquidity Sweep — Stop Hunt Concept
Before expansion, price may collect liquidity.
Sharp Wick Candle:
A candle moves beyond a key level and quickly returns, trapping traders.
Rejection Candle:
Shows that the breakout was not genuine.
Strong Opposite Candle:
Confirms that smart money has completed liquidity collection.
Reason:
Liquidity sweeps allow institutions to enter positions with available orders.
---
8. Current Price Action — Gold Expansion Scenario
The latest candles show bullish strength after a structural shift.
Higher High Candles:
Indicate buyers are successfully pushing price upward.
Higher Low Candles:
Show that buyers are protecting pullback areas.
Momentum Candles Near Highs:
Indicate strong demand but require confirmation near resistance.
Reason:
The market is attempting continuation while respecting important liquidity and supply zones.
---
Complete Candle Reading Lesson
Every candle explains:
Who controls the market
Where liquidity is located
Where institutions may enter
Where trend changes happen
Where price may react
This chart teaches:
Market Structure
CHoCH & BOS
Liquidity Concepts
Order Blocks
Fair Value Gaps
Supply & Demand
Institutional Price Action
A candle is not just movement — it is the footprint of market psychology. Professional traders learn to read the reason behind every candle before making decisions.
Educational Purpose: This chart is created to understand Gold (XAU/USD) Smart Money Concepts and professional market analysis.

t.me/+QuPClHzEaLwwNTBk
What You'll Get:
Daily Forex signals with high accuracy
Technical & fundamental analysis
Risk management tips to protect your capital
Join now and start winning
t.me/+QuPClHzEaLwwNTBk
What You'll Get:
Daily Forex signals with high accuracy
Technical & fundamental analysis
Risk management tips to protect your capital
Join now and start winning
t.me/+QuPClHzEaLwwNTBk
Pubblicazioni correlate
Declinazione di responsabilità
Le informazioni e le pubblicazioni non sono intese come, e non costituiscono, consulenza o raccomandazioni finanziarie, di investimento, di trading o di altro tipo fornite o approvate da TradingView. Per ulteriori informazioni, consultare i Termini di utilizzo.
t.me/+QuPClHzEaLwwNTBk
What You'll Get:
Daily Forex signals with high accuracy
Technical & fundamental analysis
Risk management tips to protect your capital
Join now and start winning
t.me/+QuPClHzEaLwwNTBk
What You'll Get:
Daily Forex signals with high accuracy
Technical & fundamental analysis
Risk management tips to protect your capital
Join now and start winning
t.me/+QuPClHzEaLwwNTBk
Pubblicazioni correlate
Declinazione di responsabilità
Le informazioni e le pubblicazioni non sono intese come, e non costituiscono, consulenza o raccomandazioni finanziarie, di investimento, di trading o di altro tipo fornite o approvate da TradingView. Per ulteriori informazioni, consultare i Termini di utilizzo.