
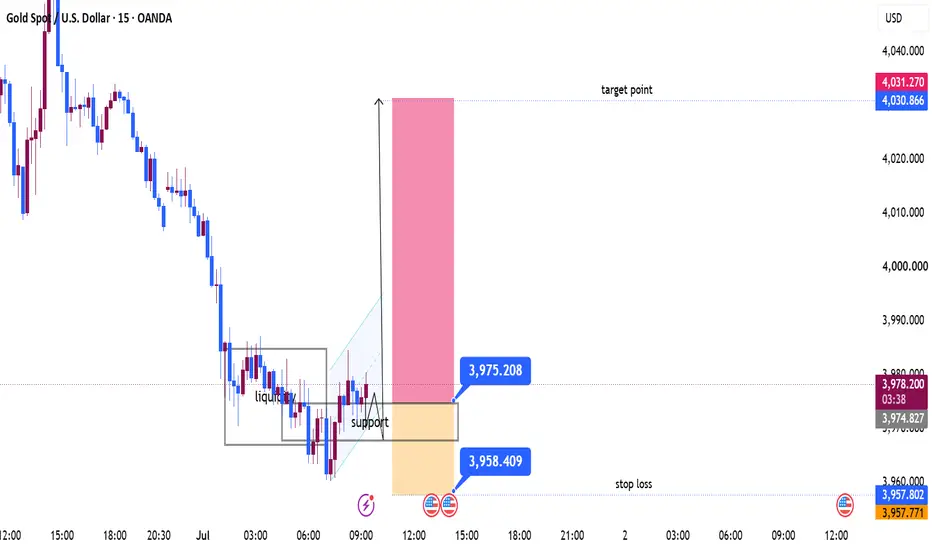
XAU/USD 15-Minute Technical Analysis (Educational)
Gold remains in a short-term bearish trend, but the chart suggests a potential bullish reversal from a well-defined support and liquidity zone.
Market Structure
The overall trend is still bearish, with a sequence of lower highs and lower lows.
Price has entered a consolidation range after the sharp decline, indicating sellers are losing momentum.
A liquidity sweep below the range appears to have occurred, followed by a quick recovery back into support, hinting at buyer interest.
Bullish Setup
Entry Zone: Around 3975.20
Support: 3970–3975
Stop Loss: 3958.40, below the recent swing low and liquidity grab.
Target: 4030.80–4031.30, aligning with the next resistance and projected measured move.
Technical Observations
The highlighted rectangle marks a strong demand/support area where buyers have repeatedly defended price.
The liquidity sweep beneath the range may have trapped late sellers, increasing the probability of an upside move.
A breakout above the recent consolidation highs would confirm bullish momentum.
If price fails to hold above 3970, the bullish setup becomes invalid and another leg lower toward the stop-loss area becomes more likely.
Trade Management
Wait for a strong bullish candle or higher-low confirmation before entering.
Consider moving the stop to breakeven once price reaches the first resistance around 3990–4000.
Monitor volume and price action near resistance, as profit-taking could trigger a pullback before continuation.
Bias
Short-term: Bullish (counter-trend rebound)
Overall trend: Bearish until price breaks above the recent lower-high structure.
Gold remains in a short-term bearish trend, but the chart suggests a potential bullish reversal from a well-defined support and liquidity zone.
Market Structure
The overall trend is still bearish, with a sequence of lower highs and lower lows.
Price has entered a consolidation range after the sharp decline, indicating sellers are losing momentum.
A liquidity sweep below the range appears to have occurred, followed by a quick recovery back into support, hinting at buyer interest.
Bullish Setup
Entry Zone: Around 3975.20
Support: 3970–3975
Stop Loss: 3958.40, below the recent swing low and liquidity grab.
Target: 4030.80–4031.30, aligning with the next resistance and projected measured move.
Technical Observations
The highlighted rectangle marks a strong demand/support area where buyers have repeatedly defended price.
The liquidity sweep beneath the range may have trapped late sellers, increasing the probability of an upside move.
A breakout above the recent consolidation highs would confirm bullish momentum.
If price fails to hold above 3970, the bullish setup becomes invalid and another leg lower toward the stop-loss area becomes more likely.
Trade Management
Wait for a strong bullish candle or higher-low confirmation before entering.
Consider moving the stop to breakeven once price reaches the first resistance around 3990–4000.
Monitor volume and price action near resistance, as profit-taking could trigger a pullback before continuation.
Bias
Short-term: Bullish (counter-trend rebound)
Overall trend: Bearish until price breaks above the recent lower-high structure.
Trade chiuso: obiettivo raggiunto

join my telegram channel t.me/goldsignalicthttps://t.me/goldsignalicthttps://t.me/goldsignalict
Declinazione di responsabilità
Le informazioni e le pubblicazioni non sono intese come, e non costituiscono, consulenza o raccomandazioni finanziarie, di investimento, di trading o di altro tipo fornite o approvate da TradingView. Per ulteriori informazioni, consultare i Termini di utilizzo.
join my telegram channel t.me/goldsignalicthttps://t.me/goldsignalicthttps://t.me/goldsignalict
Declinazione di responsabilità
Le informazioni e le pubblicazioni non sono intese come, e non costituiscono, consulenza o raccomandazioni finanziarie, di investimento, di trading o di altro tipo fornite o approvate da TradingView. Per ulteriori informazioni, consultare i Termini di utilizzo.