
Last week’s price action was a typical news-driven bounce, but what matters is not the move itself — it’s the lack of continuation afterward. Gold reacted to news, but failed to sustain momentum, showing a clear absence of follow-through. This is a key signal that buy-side strength is fading, not building. In a strong market, news acts as a catalyst for expansion, but in this case, it only created short-term volatility before being absorbed. That tells us that larger capital is not interested in pushing price higher at current levels.
From a macro perspective, the market is transitioning into a slower phase — one where momentum fades, volatility compresses, and both sides become more selective. Buyers are losing conviction as price fails to break higher, while sellers remain patient, waiting for optimal zones rather than chasing price. This creates a grinding environment, where price slowly bleeds within a range, forming a sideway-down structure. This type of behavior often appears before a larger move, especially when the market is waiting for a stronger macro catalyst such as interest rate expectations or geopolitical developments.
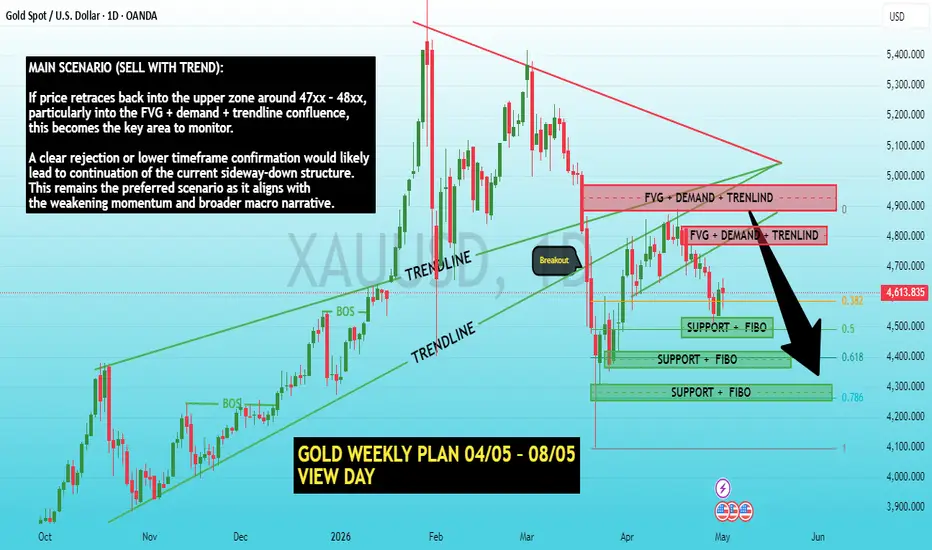
Looking at the chart, price is still operating below key structural zones. The upper area, where FVG aligns with demand and trendline, remains a critical liquidity zone where price is likely to revisit before continuing its move. Meanwhile, the lower zones around Fibo 0.5 – 0.618 act only as reaction levels, not strong enough to shift the overall trend. This keeps the broader bias intact — a controlled, slow downside rather than an aggressive trend.
MAIN SCENARIO (SELL WITH TREND):
If price retraces back into the upper zone around 47xx – 48xx, particularly into the FVG + demand + trendline confluence, this becomes the key area to monitor. A clear rejection or lower timeframe confirmation would likely lead to continuation of the current sideway-down structure. This remains the preferred scenario as it aligns with the weakening momentum and broader macro narrative.
ALTERNATIVE SCENARIO (SHORT-TERM REACTION):
If price continues to drop without a proper retracement, gold may react at the lower zones around Fibo 0.5 – 0.618. However, these reactions are likely to be short-term in nature, suitable only for scalp opportunities. Without a structural shift or strong inflow of capital, these zones are unlikely to produce a sustained reversal.
Overall, gold is showing signs of gradual weakness in the bigger picture, with capital flow slowing down and market behavior shifting into a distribution phase. This is not a market for chasing moves, but for waiting patiently at key levels. The primary bias remains selling on retracements, but execution requires discipline and patience, especially in a slow and compressed market environment.
LucasGrayTrading
From a macro perspective, the market is transitioning into a slower phase — one where momentum fades, volatility compresses, and both sides become more selective. Buyers are losing conviction as price fails to break higher, while sellers remain patient, waiting for optimal zones rather than chasing price. This creates a grinding environment, where price slowly bleeds within a range, forming a sideway-down structure. This type of behavior often appears before a larger move, especially when the market is waiting for a stronger macro catalyst such as interest rate expectations or geopolitical developments.
Looking at the chart, price is still operating below key structural zones. The upper area, where FVG aligns with demand and trendline, remains a critical liquidity zone where price is likely to revisit before continuing its move. Meanwhile, the lower zones around Fibo 0.5 – 0.618 act only as reaction levels, not strong enough to shift the overall trend. This keeps the broader bias intact — a controlled, slow downside rather than an aggressive trend.
MAIN SCENARIO (SELL WITH TREND):
If price retraces back into the upper zone around 47xx – 48xx, particularly into the FVG + demand + trendline confluence, this becomes the key area to monitor. A clear rejection or lower timeframe confirmation would likely lead to continuation of the current sideway-down structure. This remains the preferred scenario as it aligns with the weakening momentum and broader macro narrative.
ALTERNATIVE SCENARIO (SHORT-TERM REACTION):
If price continues to drop without a proper retracement, gold may react at the lower zones around Fibo 0.5 – 0.618. However, these reactions are likely to be short-term in nature, suitable only for scalp opportunities. Without a structural shift or strong inflow of capital, these zones are unlikely to produce a sustained reversal.
Overall, gold is showing signs of gradual weakness in the bigger picture, with capital flow slowing down and market behavior shifting into a distribution phase. This is not a market for chasing moves, but for waiting patiently at key levels. The primary bias remains selling on retracements, but execution requires discipline and patience, especially in a slow and compressed market environment.
LucasGrayTrading
Trade attivo
Gold reacted as expected upon touching the support zone + 452x Fibonacci level, creating a strong rebound of approximately 600 pips. This is a clean technical reaction, indicating that the lower zone still has short-term support from bargain-hunting investors.However, it's important to understand the underlying nature of the situation: this is still a pullback within a downtrend, with no confirmation of a reversal yet. The price is currently approaching the intermediate zone of ~457x–458x, the area where the previous breakdown occurred.
If the pullback continues, gold is likely to retest the upper resistance zones (fvg/demand/trendline) to create a trend-following sell setup. Conversely, if the 455x zone is lost again, the weak structure will continue, and the price may retest the previous low.
Conclusion:
600 pip bounce = correct technical reaction to the zone
The main trend remains sideways down → SELL bias
Priority: wait for a pullback to the upper zone to continue selling according to bias
Trade chiuso: obiettivo raggiunto
Weekly plan update (May 4-8): Gold continued to move within the structural range mentioned in the weekly plan. After touching the lower support zone and key Fibonacci levels, the price experienced a strong rebound, combined with support from economic news and market sentiment, creating a recovery of nearly 2600 pips towards the demand zone, trendline, and FVG above.As expected, the 47xx-48xx zone continued to be a crucial liquidity area as gold began to react and stall around the demand zone above. This indicates that large capital flows are still closely monitoring the liquidity zones above, rather than fully confirming a new long-term bullish trend.
Overall, the recent rally was driven more by technical recovery and news reactions than by changes in the long-term macroeconomic structure. The market remains in a tug-of-war between recession expectations, interest rate pressure, and global economic fluctuations.
The weekly plan is generally moving in the right direction, aligning with the bias and liquidity levels set at the beginning of the week. A detailed view for the following week will be updated in the upcoming plan.

Daily trend & Supply/Demand insights 📊
👉 t.me/+cZC_DmEr3OwzOTA1
High-probability zones & structured setups
Clear scenarios for better decision-making
Trade smarter with LucasGrayTrading 🎖
👉 t.me/+cZC_DmEr3OwzOTA1
High-probability zones & structured setups
Clear scenarios for better decision-making
Trade smarter with LucasGrayTrading 🎖
Declinazione di responsabilità
Le informazioni e le pubblicazioni non sono intese come, e non costituiscono, consulenza o raccomandazioni finanziarie, di investimento, di trading o di altro tipo fornite o approvate da TradingView. Per ulteriori informazioni, consultare i Termini di utilizzo.
Daily trend & Supply/Demand insights 📊
👉 t.me/+cZC_DmEr3OwzOTA1
High-probability zones & structured setups
Clear scenarios for better decision-making
Trade smarter with LucasGrayTrading 🎖
👉 t.me/+cZC_DmEr3OwzOTA1
High-probability zones & structured setups
Clear scenarios for better decision-making
Trade smarter with LucasGrayTrading 🎖
Declinazione di responsabilità
Le informazioni e le pubblicazioni non sono intese come, e non costituiscono, consulenza o raccomandazioni finanziarie, di investimento, di trading o di altro tipo fornite o approvate da TradingView. Per ulteriori informazioni, consultare i Termini di utilizzo.