
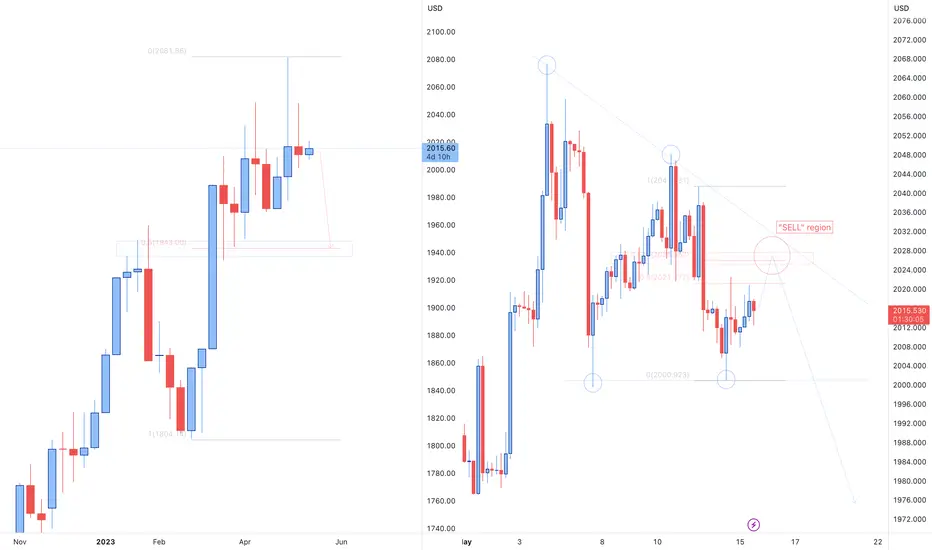
As thoroughly demonstrated in the publication made on Gold last week, deriving from the Weekly-timeframe graph (on the left-hand side of the screen), we are anticipating for the price to pull back into the crucial region of support lining up with the 50% Fibonacci retracement level as highlighted on the chart. Zooming into the H4 TF and adding up to the confluences, we might infer that the price has formed a descending triangle pattern and might touch the zone pictured on the graphic (the upper boundary of the triangle) once again before initiating a full-scale drop as planned.

Pubblicazioni correlate
Declinazione di responsabilità
Le informazioni e le pubblicazioni non sono intese come, e non costituiscono, consulenza o raccomandazioni finanziarie, di investimento, di trading o di altro tipo fornite o approvate da TradingView. Per ulteriori informazioni, consultare i Termini di utilizzo.
Pubblicazioni correlate
Declinazione di responsabilità
Le informazioni e le pubblicazioni non sono intese come, e non costituiscono, consulenza o raccomandazioni finanziarie, di investimento, di trading o di altro tipo fornite o approvate da TradingView. Per ulteriori informazioni, consultare i Termini di utilizzo.