
My recommendations:
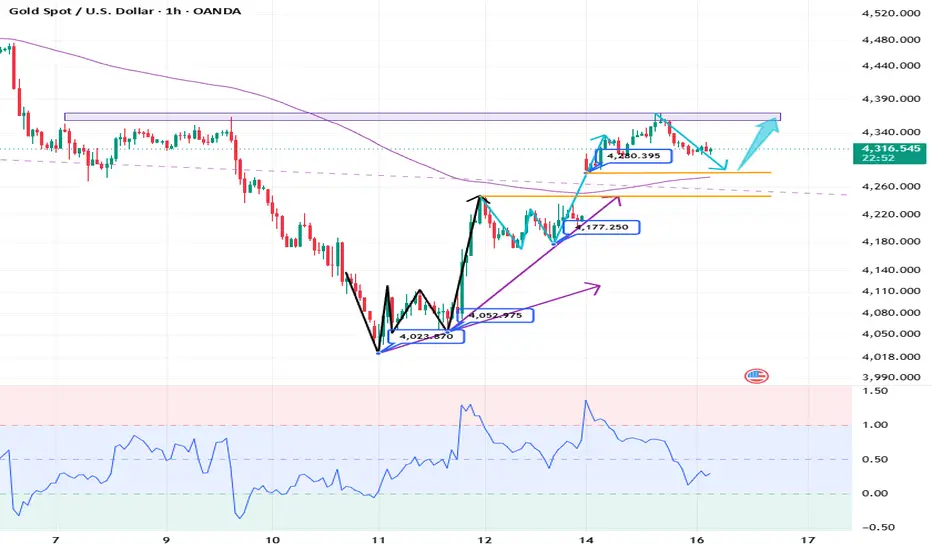
BUY: 4280-4290, SL: 4260, TP: 4340-4370;
SELL: 4360-4370, SL: 4390, TP: 4310-4280;
Gold prices rose and climbed above the MA10/7-day moving averages, with support at 4292/4243. The RSI indicator turned upwards, but remains below 50. Prices are trading within the lower half of the Bollinger Bands, and the daily chart structure remains within a downward channel. On the shorter-term 4-hour and 1-hour charts, following yesterday's continued upward trend, the moving averages are crossing upwards, and the RSI indicator is above the 50 level, indicating a short-term upward trend.
The positive effects of the US-Iran peace talks have already been priced in, and the geopolitical boost has faded. The market is now awaiting Warsh's first Fed meeting, where the policy stance remains unclear. The market is expected to fluctuate before the decision, and after all the positive news has been priced in, gold prices will likely face short-term downward pressure. After bottoming out in Asian trading, the price is consolidating at low levels, awaiting a market direction. The 4360-4380 level represents short-term resistance, while the 4280-4300 level is key support.
BUY: 4280-4290, SL: 4260, TP: 4340-4370;
SELL: 4360-4370, SL: 4390, TP: 4310-4280;
Gold prices rose and climbed above the MA10/7-day moving averages, with support at 4292/4243. The RSI indicator turned upwards, but remains below 50. Prices are trading within the lower half of the Bollinger Bands, and the daily chart structure remains within a downward channel. On the shorter-term 4-hour and 1-hour charts, following yesterday's continued upward trend, the moving averages are crossing upwards, and the RSI indicator is above the 50 level, indicating a short-term upward trend.
The positive effects of the US-Iran peace talks have already been priced in, and the geopolitical boost has faded. The market is now awaiting Warsh's first Fed meeting, where the policy stance remains unclear. The market is expected to fluctuate before the decision, and after all the positive news has been priced in, gold prices will likely face short-term downward pressure. After bottoming out in Asian trading, the price is consolidating at low levels, awaiting a market direction. The 4360-4380 level represents short-term resistance, while the 4280-4300 level is key support.

💥 Full-time finance professional.
💥More than 11 years of experience in gold trading
⬇️I will guide you to profitability.
My Telegram : t.me/JungoldAnalyst
💥More than 11 years of experience in gold trading
⬇️I will guide you to profitability.
My Telegram : t.me/JungoldAnalyst
Declinazione di responsabilità
Le informazioni e le pubblicazioni non sono intese come, e non costituiscono, consulenza o raccomandazioni finanziarie, di investimento, di trading o di altro tipo fornite o approvate da TradingView. Per ulteriori informazioni, consultare i Termini di utilizzo.
💥 Full-time finance professional.
💥More than 11 years of experience in gold trading
⬇️I will guide you to profitability.
My Telegram : t.me/JungoldAnalyst
💥More than 11 years of experience in gold trading
⬇️I will guide you to profitability.
My Telegram : t.me/JungoldAnalyst
Declinazione di responsabilità
Le informazioni e le pubblicazioni non sono intese come, e non costituiscono, consulenza o raccomandazioni finanziarie, di investimento, di trading o di altro tipo fornite o approvate da TradingView. Per ulteriori informazioni, consultare i Termini di utilizzo.