
This article will enhance the definition and guidelines for using EMA in the ARZ Trading System.
General Conditions and Significance:
Each EMA's usage:
Let's analyze this chart:
General Conditions and Significance:
- Trend Direction: Price should pull back (at least once) and then resume making new highs/lows, with the candle body (uptrend/downtrend).
- Trend Strength: the steepness of the EMA slope.
- Ranging: If the EMA is flat or the price repeatedly crosses and closes without pullbacks, it indicates a range.
Each EMA's usage:
- 7EMA: Spike and Master Candle Identification. Spike: a trending market based on 7EMA. Once the price is crossed and closed 7EMA with a candle body, look to the left to find the Master Candle.
- 20EMA: Minor Structure. Always trade in the direction of minor trends unless it’s a minor range.
- 50EMA: Major Structure. Serves as a key level to indicate default buying or selling conditions: if the price is above, it suggests buying; if below, it suggests selling.
- 100EMA and 200EMA: Just as a key level for analyzing price.
Let's analyze this chart:
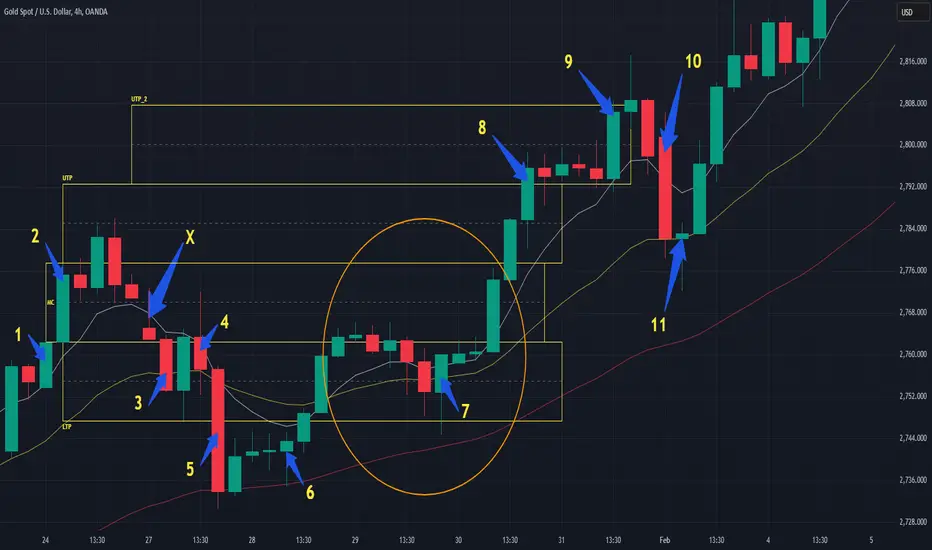
- In candle #1, the price has crossed and closed and created a new high. So it is a pullback and we are in an upward Spike.
- In candle, X price has crossed and closed below 7EMA, after giving at least one pullback to it. So we look to the left to find the MC (Master Candle) which is candle #2.
- In candle #3, the price has crossed and closed below 20EMA, so if in the future the price can't break the 7EMA upward, it most likely will continue a downward Spike until reaching the LTP of the MC (which happened after giving pullback to 7EMA in candle #4). We expect this behaviour.
- After breaking the LTP, although the candle is huge, it wasn't able to break the 50EMA (Exhaustion Candle). It is a sign of a possible reversal to the MC. Candle #6 is a Signal Bar (which will be covered in future) and confirms it.
- In the circled area, we are in MC (Ranging Market) and this type of behaviour is normal. Until we see another Signal Bar at #7 which is after rejecting the price from multiple levels (LTP, mid-LTP, 7EMA, 20EMA). A clear sign of continuing upward.
- In candle #8, the price crossed and closed above UTP, followed by a pullback and a higher close in candle #9. At the same time, we reached the next TP based on UTP_2.
- Becaused price has reached UTP_2, if 7EMA crossed and closed again we have to find a new MC. Candle #10 shows us that Candle #9 is the new MC. At candle #11 we have a Signal Bar at LTP and 20EMA. The perfect setup to go long!

Declinazione di responsabilità
Le informazioni e le pubblicazioni non sono intese come, e non costituiscono, consulenza o raccomandazioni finanziarie, di investimento, di trading o di altro tipo fornite o approvate da TradingView. Per ulteriori informazioni, consultare i Termini di utilizzo.
Declinazione di responsabilità
Le informazioni e le pubblicazioni non sono intese come, e non costituiscono, consulenza o raccomandazioni finanziarie, di investimento, di trading o di altro tipo fornite o approvate da TradingView. Per ulteriori informazioni, consultare i Termini di utilizzo.