
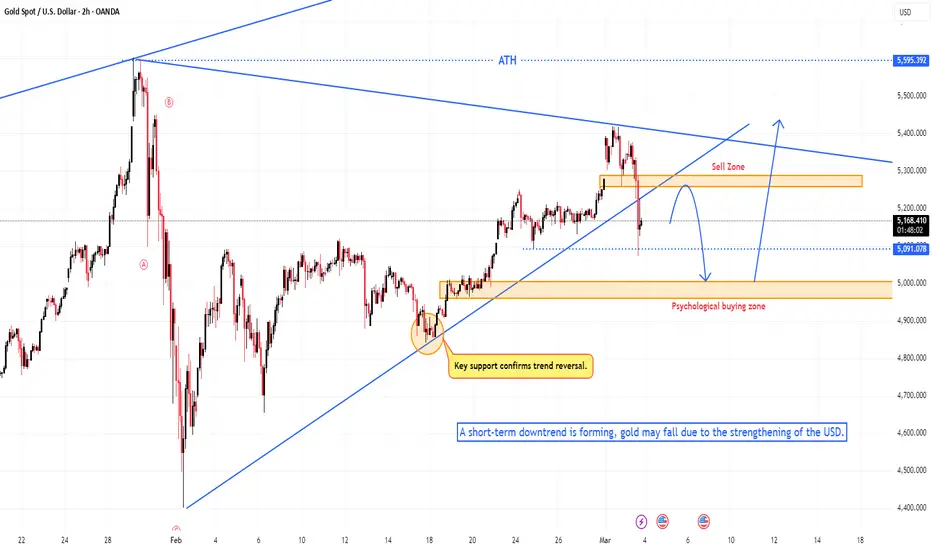
A pullback into the trendline, then continuation lower looks likely
Price is entering a phase that often creates confusion. After a strong bullish push, the market isn’t extending cleanly — it’s shifting into a pullback → retest → decision environment. On H2, the most important detail is how price behaves as it returns to the rising trendline and the supply area above.
The structure suggests a familiar sequence:
price retraces into the trendline / supply zone → sellers step in → price rotates back down into the lower demand (psychological) area.
What the structure is showing
The prior rally came off a key support area — the kind of base that typically confirms buyers are back in control. But as price pushes higher, it runs into a combination of dynamic resistance (trendline / descending barrier) and horizontal supply.
This is where the market often plays its favorite trick: it pulls up to make continuation feel obvious, then sells into that optimism and drives lower again. This is also the zone where late chasers get trapped.
Key areas in focus
Sell zone (where rejection is likely)
The region around 5,28xx – 5,30xx is the sensitive area. This is where price can retest and show weakness. Kelly treats this as a defensive zone — it’s not a place to chase longs. It’s a place to watch for clean rejection signals.
Key support (structure boundary)
The level near 5,091 is the line that matters. It helps separate a healthy pullback from a deeper bearish rotation.
Psychological buying zone (liquidity magnet)
The area around 5,00xx is a classic liquidity pocket. If price is pushed lower, this is where defensive buying often appears — and where a more meaningful rebound can form after the market finishes its “flush.”
Primary scenario: trendline retest, then continuation lower
If price rallies back toward the trendline and the sell zone, then prints weakness such as:
strong upper-wick rejection candles
failure to hold above 5,28xx–5,30xx followed by a sharp drop back below
a break of the minor bullish structure on H2 (losing the most recent swing low)
→ then the probability increases that price rotates back down toward 5,091, and if selling pressure stays active, the next drawdown can extend into 5,00xx.
Alternative scenario: dip-to-buy after the flush
If price sweeps 5,091 or pushes deeper into 5,00xx and then shows acceptance and strength (long lower wick, reclaim of the level, or a break of the minor bearish structure)
→ this becomes a reasonable area to look for a short-term base and a stronger rebound back toward the upper resistance zone.
Invalidation (risk discipline)
If price breaks above and holds above the sell zone (especially with a clean close above 5,30xx)
→ the “retest then drop” idea weakens significantly. At that point, Kelly avoids forcing shorts and waits for a fresh retest structure to confirm the next direction.
Kelly’s CONCLUDE
This is a “retest phase.” The edge comes from watching the reaction at the trendline + sell zone. If rejection shows up, a continuation move toward 5,091 — and potentially 5,00xx — becomes the higher-probability path before the market builds a more meaningful rebound.
Kelly doesn’t chase candles. Kelly follows structure and price reaction at the right levels.
Price is entering a phase that often creates confusion. After a strong bullish push, the market isn’t extending cleanly — it’s shifting into a pullback → retest → decision environment. On H2, the most important detail is how price behaves as it returns to the rising trendline and the supply area above.
The structure suggests a familiar sequence:
price retraces into the trendline / supply zone → sellers step in → price rotates back down into the lower demand (psychological) area.
What the structure is showing
The prior rally came off a key support area — the kind of base that typically confirms buyers are back in control. But as price pushes higher, it runs into a combination of dynamic resistance (trendline / descending barrier) and horizontal supply.
This is where the market often plays its favorite trick: it pulls up to make continuation feel obvious, then sells into that optimism and drives lower again. This is also the zone where late chasers get trapped.
Key areas in focus
Sell zone (where rejection is likely)
The region around 5,28xx – 5,30xx is the sensitive area. This is where price can retest and show weakness. Kelly treats this as a defensive zone — it’s not a place to chase longs. It’s a place to watch for clean rejection signals.
Key support (structure boundary)
The level near 5,091 is the line that matters. It helps separate a healthy pullback from a deeper bearish rotation.
Psychological buying zone (liquidity magnet)
The area around 5,00xx is a classic liquidity pocket. If price is pushed lower, this is where defensive buying often appears — and where a more meaningful rebound can form after the market finishes its “flush.”
Primary scenario: trendline retest, then continuation lower
If price rallies back toward the trendline and the sell zone, then prints weakness such as:
strong upper-wick rejection candles
failure to hold above 5,28xx–5,30xx followed by a sharp drop back below
a break of the minor bullish structure on H2 (losing the most recent swing low)
→ then the probability increases that price rotates back down toward 5,091, and if selling pressure stays active, the next drawdown can extend into 5,00xx.
Alternative scenario: dip-to-buy after the flush
If price sweeps 5,091 or pushes deeper into 5,00xx and then shows acceptance and strength (long lower wick, reclaim of the level, or a break of the minor bearish structure)
→ this becomes a reasonable area to look for a short-term base and a stronger rebound back toward the upper resistance zone.
Invalidation (risk discipline)
If price breaks above and holds above the sell zone (especially with a clean close above 5,30xx)
→ the “retest then drop” idea weakens significantly. At that point, Kelly avoids forcing shorts and waits for a fresh retest structure to confirm the next direction.
Kelly’s CONCLUDE
This is a “retest phase.” The edge comes from watching the reaction at the trendline + sell zone. If rejection shows up, a continuation move toward 5,091 — and potentially 5,00xx — becomes the higher-probability path before the market builds a more meaningful rebound.
Kelly doesn’t chase candles. Kelly follows structure and price reaction at the right levels.

📌 New analysis published daily
🔔 Follow this profile for real-time updates
⚠️ This is personal analysis, not financial advice
Daily GOLD and Forex updates: t.me/+SOSI26CZOJ1mZDhl
🔔 Follow this profile for real-time updates
⚠️ This is personal analysis, not financial advice
Daily GOLD and Forex updates: t.me/+SOSI26CZOJ1mZDhl
Declinazione di responsabilità
Le informazioni e le pubblicazioni non sono intese come, e non costituiscono, consulenza o raccomandazioni finanziarie, di investimento, di trading o di altro tipo fornite o approvate da TradingView. Per ulteriori informazioni, consultare i Termini di utilizzo.
📌 New analysis published daily
🔔 Follow this profile for real-time updates
⚠️ This is personal analysis, not financial advice
Daily GOLD and Forex updates: t.me/+SOSI26CZOJ1mZDhl
🔔 Follow this profile for real-time updates
⚠️ This is personal analysis, not financial advice
Daily GOLD and Forex updates: t.me/+SOSI26CZOJ1mZDhl
Declinazione di responsabilità
Le informazioni e le pubblicazioni non sono intese come, e non costituiscono, consulenza o raccomandazioni finanziarie, di investimento, di trading o di altro tipo fornite o approvate da TradingView. Per ulteriori informazioni, consultare i Termini di utilizzo.