
💎 XAUUSD Macro Algo Map: 4024 Core Breakdown & Bearish Rejection
📋 Report ID: XAUUSD-WEEKLY-UPDATE-2026-W29
Asset: Gold Spot (XAU/USD)
Timeframe: Weekly (Macro) / Daily (Swing)
📊 Data Anchor: Week of July 13, 2026
🔭 Macro Outlook: Week of July 20, 2026
🔭 Market Context & Price Action
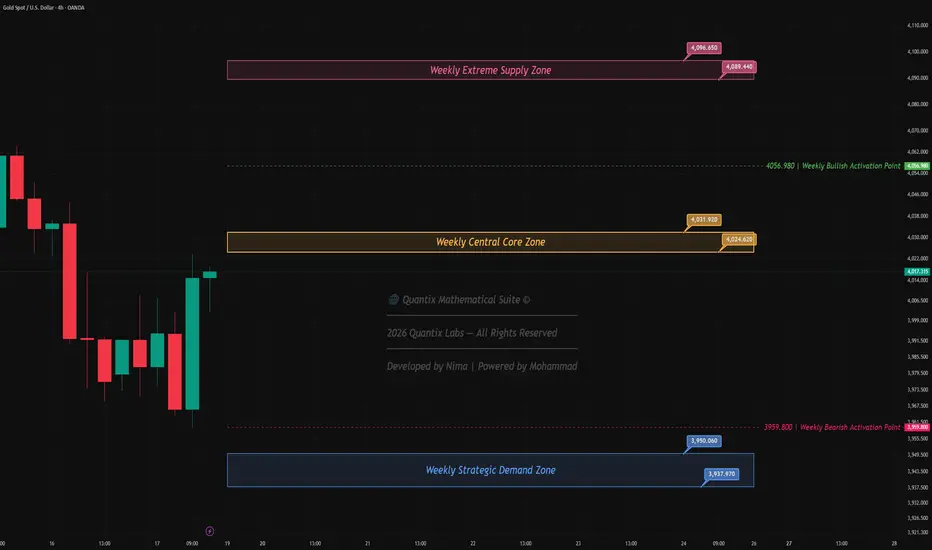
The macro weekly structure for Gold (XAUUSD) has printed a clear bearish rejection candle. After opening at 4090.980 and executing a fake liquidity sweep to a high of 4104.050, the market was struck by heavy institutional supply, plunging to a physical low of 3959.800. Although buyers managed a slight recovery to close at 4017.315, the price remains firmly trapped below all central computational pivots. This confirms a macro momentum shift in favor of the sellers.
🎯 Key Structural Price Zones
The following macro zones are derived from the precise density of calculated structural levels:
🔴 Extreme Resistance (Supply Cluster): 4089.440 - 4096.650
This formidable overhead barrier is formed by a heavy confluence of computational resistance levels at 4089.440 and 4094.310, capped by an extreme macro boundary at 4096.650. Positioned near the weekly open, this zone acts as the ultimate ceiling defending the bearish structure against any major upside reversal.
🔘 Central Core Zone (Decision Point): 4024.620 - 4031.920
The pivotal center of gravity of the macro market. This dense computational band encompasses key mathematical pivots (4024.620 and 4027.050), the proprietary quantitative core (4025.500), and the 50% Equilibrium boundary (4031.920). Closing the week below this massive fault line establishes it as a heavy "glass ceiling" (Flip Zone). As long as price compresses below this area, downside pressure dominates.
🔵 Strategic Support (Demand Cluster): 3937.970 - 3950.060
This deep discount zone acts as an extreme structural safety net. It represents an exceptional alignment of a lower structural support block at 3950.060 with a major macro breakdown boundary at 3937.970. Positioned below the physical weekly low, this is the primary liquidity target for the bears.
⚖️ Phase Transition & Order Flow
Support and resistance boundaries act as the exact gateways for market phase transitions:
📉 Structural Breakdown (Bearish Shift): The macro structure is in a corrective phase. A decisive break below the weekly physical low of 3959.800 will accelerate the downward flow toward the deep 3937 demand cluster.
📈 Structural Breakout (Bullish Shift): Only a confirmed daily close above the 4056.980 macro resistance threshold will invalidate the current bearish scenario and transition the market back into a neutral or bullish macro phase.
📝 Trade Scenarios (Cautious Bearish Bias)
The market's immediate directional impulse relies on the 4024-4031 resistance ceiling:
🔴 Bearish Scenario (Sell on Rally): The dominant macro trend is currently in structural correction. The highest probability scenario for the upcoming week is a bullish pullback toward the 4024 - 4031 DP Zone, which serves to reactivate institutional sell orders. The primary targets are a retest of the 3959.800 floor, followed by an aggressive push into the 3937 support cluster.
🟢 Bullish Scenario: To neutralize the bearish momentum, buyers must violently defend the physical lows and break above the central core. A confirmed daily close above 4056.980 is strictly required to trap the bears and trigger a structural recovery.
──────────────
Trade Safe and follow the structure.
By: ◈ Quantix Labs
📋 Report ID: XAUUSD-WEEKLY-UPDATE-2026-W29
Asset: Gold Spot (XAU/USD)
Timeframe: Weekly (Macro) / Daily (Swing)
📊 Data Anchor: Week of July 13, 2026
🔭 Macro Outlook: Week of July 20, 2026
🔭 Market Context & Price Action
The macro weekly structure for Gold (XAUUSD) has printed a clear bearish rejection candle. After opening at 4090.980 and executing a fake liquidity sweep to a high of 4104.050, the market was struck by heavy institutional supply, plunging to a physical low of 3959.800. Although buyers managed a slight recovery to close at 4017.315, the price remains firmly trapped below all central computational pivots. This confirms a macro momentum shift in favor of the sellers.
🎯 Key Structural Price Zones
The following macro zones are derived from the precise density of calculated structural levels:
🔴 Extreme Resistance (Supply Cluster): 4089.440 - 4096.650
This formidable overhead barrier is formed by a heavy confluence of computational resistance levels at 4089.440 and 4094.310, capped by an extreme macro boundary at 4096.650. Positioned near the weekly open, this zone acts as the ultimate ceiling defending the bearish structure against any major upside reversal.
🔘 Central Core Zone (Decision Point): 4024.620 - 4031.920
The pivotal center of gravity of the macro market. This dense computational band encompasses key mathematical pivots (4024.620 and 4027.050), the proprietary quantitative core (4025.500), and the 50% Equilibrium boundary (4031.920). Closing the week below this massive fault line establishes it as a heavy "glass ceiling" (Flip Zone). As long as price compresses below this area, downside pressure dominates.
🔵 Strategic Support (Demand Cluster): 3937.970 - 3950.060
This deep discount zone acts as an extreme structural safety net. It represents an exceptional alignment of a lower structural support block at 3950.060 with a major macro breakdown boundary at 3937.970. Positioned below the physical weekly low, this is the primary liquidity target for the bears.
⚖️ Phase Transition & Order Flow
Support and resistance boundaries act as the exact gateways for market phase transitions:
📉 Structural Breakdown (Bearish Shift): The macro structure is in a corrective phase. A decisive break below the weekly physical low of 3959.800 will accelerate the downward flow toward the deep 3937 demand cluster.
📈 Structural Breakout (Bullish Shift): Only a confirmed daily close above the 4056.980 macro resistance threshold will invalidate the current bearish scenario and transition the market back into a neutral or bullish macro phase.
📝 Trade Scenarios (Cautious Bearish Bias)
The market's immediate directional impulse relies on the 4024-4031 resistance ceiling:
🔴 Bearish Scenario (Sell on Rally): The dominant macro trend is currently in structural correction. The highest probability scenario for the upcoming week is a bullish pullback toward the 4024 - 4031 DP Zone, which serves to reactivate institutional sell orders. The primary targets are a retest of the 3959.800 floor, followed by an aggressive push into the 3937 support cluster.
🟢 Bullish Scenario: To neutralize the bearish momentum, buyers must violently defend the physical lows and break above the central core. A confirmed daily close above 4056.980 is strictly required to trap the bears and trigger a structural recovery.
──────────────
Trade Safe and follow the structure.
By: ◈ Quantix Labs

Q U A N T I X L A B S
Structure. Precision. Edge.
─────────────────────────────
Professional-grade tools for serious traders
─────────────────────────────
📊 @QuantixTrade | 💬 @Nima_Sanedoust
Structure. Precision. Edge.
─────────────────────────────
Professional-grade tools for serious traders
─────────────────────────────
📊 @QuantixTrade | 💬 @Nima_Sanedoust
Declinazione di responsabilità
Le informazioni e le pubblicazioni non sono intese come, e non costituiscono, consulenza o raccomandazioni finanziarie, di investimento, di trading o di altro tipo fornite o approvate da TradingView. Per ulteriori informazioni, consultare i Termini di utilizzo.
Q U A N T I X L A B S
Structure. Precision. Edge.
─────────────────────────────
Professional-grade tools for serious traders
─────────────────────────────
📊 @QuantixTrade | 💬 @Nima_Sanedoust
Structure. Precision. Edge.
─────────────────────────────
Professional-grade tools for serious traders
─────────────────────────────
📊 @QuantixTrade | 💬 @Nima_Sanedoust
Declinazione di responsabilità
Le informazioni e le pubblicazioni non sono intese come, e non costituiscono, consulenza o raccomandazioni finanziarie, di investimento, di trading o di altro tipo fornite o approvate da TradingView. Per ulteriori informazioni, consultare i Termini di utilizzo.