
Short-term recovery inside a larger bullish cycle 💛
Quick market recap
2025 performance: Gold surged ~64%, the strongest annual gain since 1979
Recent move: Sharp year-end correction driven by profit-taking and margin adjustments, not trend reversal
Big picture: The multi-year bull market in precious metals remains intact
Fundamental context (why the trend still matters)
Despite the late-2025 pullback, the broader precious metals complex remains structurally strong. Gold, silver, platinum, and palladium all benefited from:
Fed rate-cut cycle expectations
Persistent geopolitical tensions
Strong central bank buying
Industrial demand and supply constraints (especially for silver and platinum)
Most analysts agree the recent correction was technical in nature. The long-term outlook still points toward gold potentially testing 5,000 USD/oz and silver approaching 100 USD/oz in 2026, although short-term volatility is expected to remain high.
Technical view (H1) – Based on the chart
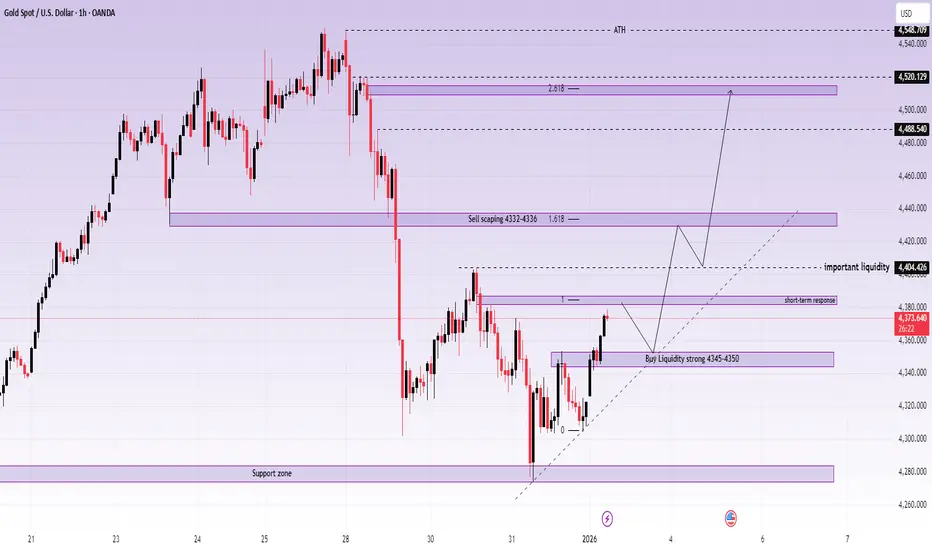
After failing to hold above the ATH, gold experienced a sharp bearish displacement, followed by a stabilization phase near a strong support zone. Price is now attempting a recovery, but the structure suggests this is still a corrective move within a broader range.
Key observations:
Strong sell-off broke short-term bullish structure
Price is rebounding from major support, forming a potential higher low
Overhead liquidity and Fibonacci zones remain key reaction areas
Key levels Lana is watching
Buy zone – Strong liquidity support
Buy: 4345 – 4350
This is a strong liquidity zone where price already reacted. If price revisits this area and holds structure, it offers a favorable risk-to-reward buy aligned with the larger bullish cycle.
Sell zone – Short-term resistance (scalping)
Sell scalping: 4332 – 4336
This zone aligns with short-term resistance and Fibonacci reaction levels. If price fails here, a brief pullback toward support is possible.
Important overhead liquidity
Key liquidity: 4404 area
A clean break and hold above this level would signal stronger bullish continuation toward higher targets.
Scenarios to consider
Scenario 1 – Range correction continues
Price reacts at short-term resistance, rotates back into liquidity, and builds a base before the next directional move.
Scenario 2 – Bullish continuation resumes
A break above overhead liquidity opens the path toward higher levels, potentially retesting prior highs as the new year unfolds.
Lana’s approach 🌿
Trade zones, not headlines
Focus on price reaction at liquidity levels
Accept short-term volatility while respecting the long-term bullish structure
This analysis reflects Lana’s personal market view and is not financial advice. Please manage risk carefully and trade responsibly 💛
Quick market recap
2025 performance: Gold surged ~64%, the strongest annual gain since 1979
Recent move: Sharp year-end correction driven by profit-taking and margin adjustments, not trend reversal
Big picture: The multi-year bull market in precious metals remains intact
Fundamental context (why the trend still matters)
Despite the late-2025 pullback, the broader precious metals complex remains structurally strong. Gold, silver, platinum, and palladium all benefited from:
Fed rate-cut cycle expectations
Persistent geopolitical tensions
Strong central bank buying
Industrial demand and supply constraints (especially for silver and platinum)
Most analysts agree the recent correction was technical in nature. The long-term outlook still points toward gold potentially testing 5,000 USD/oz and silver approaching 100 USD/oz in 2026, although short-term volatility is expected to remain high.
Technical view (H1) – Based on the chart
After failing to hold above the ATH, gold experienced a sharp bearish displacement, followed by a stabilization phase near a strong support zone. Price is now attempting a recovery, but the structure suggests this is still a corrective move within a broader range.
Key observations:
Strong sell-off broke short-term bullish structure
Price is rebounding from major support, forming a potential higher low
Overhead liquidity and Fibonacci zones remain key reaction areas
Key levels Lana is watching
Buy zone – Strong liquidity support
Buy: 4345 – 4350
This is a strong liquidity zone where price already reacted. If price revisits this area and holds structure, it offers a favorable risk-to-reward buy aligned with the larger bullish cycle.
Sell zone – Short-term resistance (scalping)
Sell scalping: 4332 – 4336
This zone aligns with short-term resistance and Fibonacci reaction levels. If price fails here, a brief pullback toward support is possible.
Important overhead liquidity
Key liquidity: 4404 area
A clean break and hold above this level would signal stronger bullish continuation toward higher targets.
Scenarios to consider
Scenario 1 – Range correction continues
Price reacts at short-term resistance, rotates back into liquidity, and builds a base before the next directional move.
Scenario 2 – Bullish continuation resumes
A break above overhead liquidity opens the path toward higher levels, potentially retesting prior highs as the new year unfolds.
Lana’s approach 🌿
Trade zones, not headlines
Focus on price reaction at liquidity levels
Accept short-term volatility while respecting the long-term bullish structure
This analysis reflects Lana’s personal market view and is not financial advice. Please manage risk carefully and trade responsibly 💛

Pubblicazioni correlate
Declinazione di responsabilità
Le informazioni e le pubblicazioni non sono intese come, e non costituiscono, consulenza o raccomandazioni finanziarie, di investimento, di trading o di altro tipo fornite o approvate da TradingView. Per ulteriori informazioni, consultare i Termini di utilizzo.
Pubblicazioni correlate
Declinazione di responsabilità
Le informazioni e le pubblicazioni non sono intese come, e non costituiscono, consulenza o raccomandazioni finanziarie, di investimento, di trading o di altro tipo fornite o approvate da TradingView. Per ulteriori informazioni, consultare i Termini di utilizzo.