
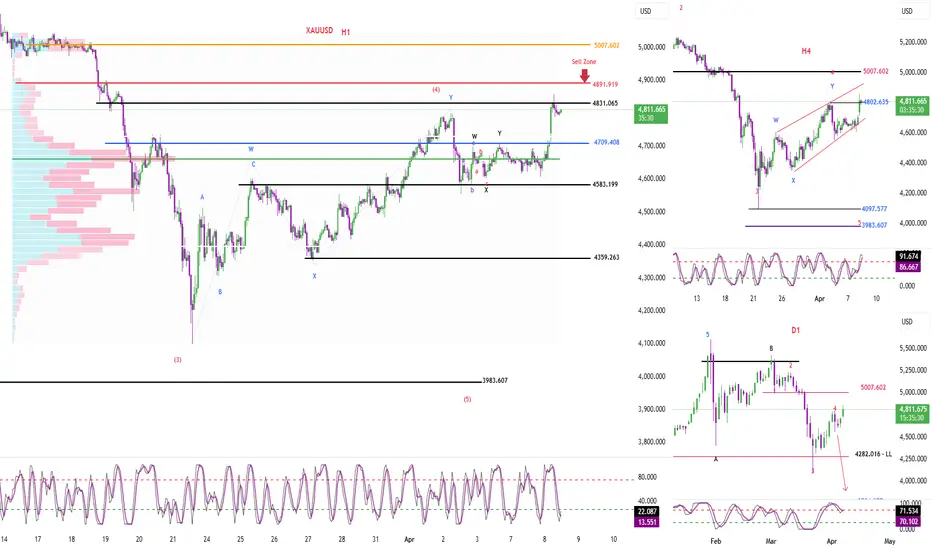
Momentum
D1
D1 momentum is currently showing signs of a reversal.
→ We need to wait for today’s candle close for confirmation.
If bullish momentum is maintained:
→ There is a high probability that the upward move will continue.
If the session closes bearish:
→ The upward move may have ended
→ Price may return to a downtrend or move sideways.
H4
H4 momentum is increasing, and the current move is at the 4th bullish candle.
→ This upward move may continue for another 1–2 H4 candles.
→ After that, a reversal on H4 may occur.
H1
H1 momentum is preparing to reverse upward.
→ If confirmed:
→ There is a high probability of a short-term upward move or sideways movement on H1.
Wave Structure
D1
With the strong bullish move breaking the previous high:
→ The scenario of Wave 4 being completed is invalidated.
Currently, there are two possibilities:
Wave 4 is still ongoing
We are in Wave 1 of a new bullish cycle
As mentioned in previous analysis:
→ The ideal condition was a panic sell-off on D1 to complete Wave 5.
→ However, this did not happen
→ Instead, we have two strong consecutive bullish candles
→ If D1 confirms a bullish reversal:
→ The upward move is likely to continue
→ And the market may enter a new bullish cycle
H4
There are currently two scenarios:
The current upward move is an ABCDE corrective structure
Or a leading triangle structure
Common point:
→ Both form a triangle pattern
→ After completion, a strong downward move may occur
Difference:
If it is a corrective structure:
→ The decline will be deep
→ Because it will be Wave 5 → potentially reaching lower targets
If it is a leading triangle (Wave 1):
→ The decline will be shallow
→ Followed by a strong Wave 3 bullish expansion
Key level: 5007
→ If price breaks this level:
→ The corrective scenario is invalidated
→ The market may enter a new structure
H1
H1 momentum is currently increasing
→ There is a possibility of a continued short-term upward move
→ However:
H4 momentum is preparing to reverse
→ This indicates that the current upward move is weakening
Volume Profile
A strong liquidity zone is located above at 4891
→ Expect a downward move from this area
→ At least following the H4 reversal
Trading Plan
Setup
Sell Zone: 4890 – 4893
SL: 4916
Take Profit:
TP1: 4831
TP2: 4709
TP3: 4583
Trade attivo
Market Update
– H4 momentum is showing signs of a bearish reversal.
→ We need to wait for the H4 candle to close (about 1 hour remaining) for confirmation.
→ If the bearish momentum is confirmed, there is a high probability of a downtrend lasting around 4–5 H4 candles.
– H1 momentum is currently increasing.
→ We wait for H1 to reach the overbought zone.
→ If price fails to break the previous high, there is a high probability of a top formation.
→ In case price breaks the previous high:
→ Continue to follow the original trading plan.

📢 Sometimes signals appear on TradingView with a slight delay!
🚀 Join our Telegram channel to get instant updates and real-time scalping signals:
👉 t.me/+lASNLyXKqcFiYmJl
🚀 Join our Telegram channel to get instant updates and real-time scalping signals:
👉 t.me/+lASNLyXKqcFiYmJl
Pubblicazioni correlate
Declinazione di responsabilità
Le informazioni e le pubblicazioni non sono intese come, e non costituiscono, consulenza o raccomandazioni finanziarie, di investimento, di trading o di altro tipo fornite o approvate da TradingView. Per ulteriori informazioni, consultare i Termini di utilizzo.
📢 Sometimes signals appear on TradingView with a slight delay!
🚀 Join our Telegram channel to get instant updates and real-time scalping signals:
👉 t.me/+lASNLyXKqcFiYmJl
🚀 Join our Telegram channel to get instant updates and real-time scalping signals:
👉 t.me/+lASNLyXKqcFiYmJl
Pubblicazioni correlate
Declinazione di responsabilità
Le informazioni e le pubblicazioni non sono intese come, e non costituiscono, consulenza o raccomandazioni finanziarie, di investimento, di trading o di altro tipo fornite o approvate da TradingView. Per ulteriori informazioni, consultare i Termini di utilizzo.