
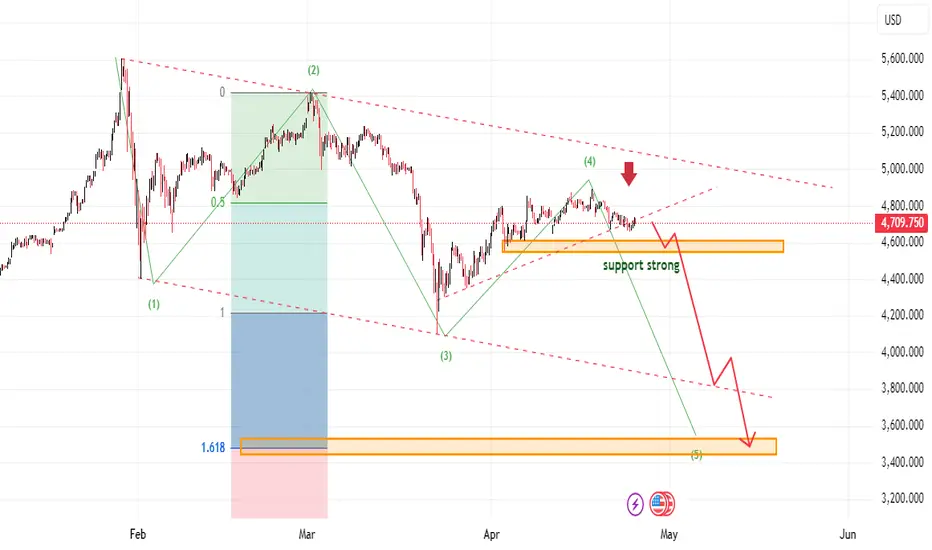
XAUUSD: H4 technical rebound, but weekly downside pressure is not over yet
Gold is recovering as hopes of renewed Iran negotiations help keep risk sentiment relatively supported. At the same time, lower US Treasury yields and a softer US Dollar are also providing short-term support for gold prices.
However, from Kelly’s perspective, the current move on the H4 timeframe still looks more like a technical recovery within a broader bearish structure than a confirmed shift into a sustainable bullish trend for the week ahead.
Technical structure on H4
On the H4 chart, gold is reacting around the 4,650–4,700 area, which is an important support zone and also a key decision point for the short-term structure. After the sharp decline seen earlier, price has managed to rebound, but so far the move has not been strong enough to break decisively through the descending resistance line above.
What stands out is that gold is still trading inside a broader descending channel, while the current rebound has only lifted price back into a technical reaction area rather than genuinely restoring bullish trend structure. That suggests buying interest is present, but not yet strong enough to change the weekly picture.
Key H4 levels to watch:
4,650–4,680: near-term support and current reaction zone
4,800–4,950: upper resistance area and supply zone
3,450: deeper liquidity zone if downside pressure returns strongly
Elliott Wave view
From an Elliott Wave perspective, the current structure still fits the idea that gold is trading in a wave 4 corrective rebound following the previous strong decline. If that count remains valid, then the current recovery would be corrective in nature before the market attempts a wave 5 decline to complete the broader structure.
This reading also aligns well with the chart itself: price is rebounding, but it remains below the major descending resistance area, and there is still no decisive breakout strong enough to invalidate the bearish count. For Kelly, that matters, because a genuine bullish reversal would usually require price to reclaim resistance and hold above it with acceptance. At the moment, gold is still only rebounding within overhead pressure.
Fibonacci and liquidity structure
From a Fibonacci perspective, the chart still leaves room for an extension towards the 1.618 area, which overlaps with the deeper liquidity zone near 3,450. Although that is not necessarily an immediate short-term target, it does suggest that the larger bearish structure may not yet be fully complete.
On the other side, the current support zone around 4,650 is still acting as a temporary holding area. If this zone continues to hold, gold may be able to extend its technical rebound into the early part of next week. But if that area gives way, downside pressure could expand more quickly.
What matters for the week ahead
From a broader weekly perspective, gold is currently being pulled by two opposing forces.
On one hand, expectations around possible renewed Iran negotiations, together with a weaker US Dollar and lower US yields, are supporting the short-term rebound. On the other hand, traders remain cautious because previous rounds of negotiations have failed before, which means uncertainty has not disappeared.
For Kelly, that means headlines may be supporting the rebound, but the H4 structure and the broader weekly structure still do not confirm a bullish reversal.
If gold can hold above the 4,650–4,680 zone, the rebound may extend towards 4,800 and possibly even the higher resistance region near 4,950. If price loses the current support area instead, the wave 5 bearish scenario would become more convincing and the market could return to a broader downside path during the remainder of the week.
Kelly’s view
For Kelly, this is not yet a chart strong enough to call a bullish reversal on H4. The current recovery has support from headlines and short-term flow, but structurally gold is still trading inside a defensive pattern with major resistance still overhead.
As long as price cannot break above and hold beyond the key H4 resistance zone, the preferred read remains the same: gold is still in a technical rebound within a broader bearish structure, and the final downside wave may not be finished yet.
Conclusion
In the short term, gold is being supported by a weaker US Dollar, softer Treasury yields, and hopes of renewed Iran negotiations. That is helping price recover on the H4 chart and defend the important 4,650–4,680 support zone.
However, from a broader weekly technical perspective, gold has not yet broken out of its larger bearish framework. In Elliott Wave terms, the current move still fits better as a wave 4 correction, while the risk of a wave 5 decline remains in place if upper resistance continues to hold.
The rebound is real.
But to change the weekly trend, gold still needs more than a technical bounce on H4.
Gold is recovering as hopes of renewed Iran negotiations help keep risk sentiment relatively supported. At the same time, lower US Treasury yields and a softer US Dollar are also providing short-term support for gold prices.
However, from Kelly’s perspective, the current move on the H4 timeframe still looks more like a technical recovery within a broader bearish structure than a confirmed shift into a sustainable bullish trend for the week ahead.
Technical structure on H4
On the H4 chart, gold is reacting around the 4,650–4,700 area, which is an important support zone and also a key decision point for the short-term structure. After the sharp decline seen earlier, price has managed to rebound, but so far the move has not been strong enough to break decisively through the descending resistance line above.
What stands out is that gold is still trading inside a broader descending channel, while the current rebound has only lifted price back into a technical reaction area rather than genuinely restoring bullish trend structure. That suggests buying interest is present, but not yet strong enough to change the weekly picture.
Key H4 levels to watch:
4,650–4,680: near-term support and current reaction zone
4,800–4,950: upper resistance area and supply zone
3,450: deeper liquidity zone if downside pressure returns strongly
Elliott Wave view
From an Elliott Wave perspective, the current structure still fits the idea that gold is trading in a wave 4 corrective rebound following the previous strong decline. If that count remains valid, then the current recovery would be corrective in nature before the market attempts a wave 5 decline to complete the broader structure.
This reading also aligns well with the chart itself: price is rebounding, but it remains below the major descending resistance area, and there is still no decisive breakout strong enough to invalidate the bearish count. For Kelly, that matters, because a genuine bullish reversal would usually require price to reclaim resistance and hold above it with acceptance. At the moment, gold is still only rebounding within overhead pressure.
Fibonacci and liquidity structure
From a Fibonacci perspective, the chart still leaves room for an extension towards the 1.618 area, which overlaps with the deeper liquidity zone near 3,450. Although that is not necessarily an immediate short-term target, it does suggest that the larger bearish structure may not yet be fully complete.
On the other side, the current support zone around 4,650 is still acting as a temporary holding area. If this zone continues to hold, gold may be able to extend its technical rebound into the early part of next week. But if that area gives way, downside pressure could expand more quickly.
What matters for the week ahead
From a broader weekly perspective, gold is currently being pulled by two opposing forces.
On one hand, expectations around possible renewed Iran negotiations, together with a weaker US Dollar and lower US yields, are supporting the short-term rebound. On the other hand, traders remain cautious because previous rounds of negotiations have failed before, which means uncertainty has not disappeared.
For Kelly, that means headlines may be supporting the rebound, but the H4 structure and the broader weekly structure still do not confirm a bullish reversal.
If gold can hold above the 4,650–4,680 zone, the rebound may extend towards 4,800 and possibly even the higher resistance region near 4,950. If price loses the current support area instead, the wave 5 bearish scenario would become more convincing and the market could return to a broader downside path during the remainder of the week.
Kelly’s view
For Kelly, this is not yet a chart strong enough to call a bullish reversal on H4. The current recovery has support from headlines and short-term flow, but structurally gold is still trading inside a defensive pattern with major resistance still overhead.
As long as price cannot break above and hold beyond the key H4 resistance zone, the preferred read remains the same: gold is still in a technical rebound within a broader bearish structure, and the final downside wave may not be finished yet.
Conclusion
In the short term, gold is being supported by a weaker US Dollar, softer Treasury yields, and hopes of renewed Iran negotiations. That is helping price recover on the H4 chart and defend the important 4,650–4,680 support zone.
However, from a broader weekly technical perspective, gold has not yet broken out of its larger bearish framework. In Elliott Wave terms, the current move still fits better as a wave 4 correction, while the risk of a wave 5 decline remains in place if upper resistance continues to hold.
The rebound is real.
But to change the weekly trend, gold still needs more than a technical bounce on H4.

📌 New analysis published daily
🔔 Follow this profile for real-time updates
⚠️ This is personal analysis, not financial advice
Daily GOLD and Forex updates: t.me/+SOSI26CZOJ1mZDhl
🔔 Follow this profile for real-time updates
⚠️ This is personal analysis, not financial advice
Daily GOLD and Forex updates: t.me/+SOSI26CZOJ1mZDhl
Pubblicazioni correlate
Declinazione di responsabilità
Le informazioni e le pubblicazioni non sono intese come, e non costituiscono, consulenza o raccomandazioni finanziarie, di investimento, di trading o di altro tipo fornite o approvate da TradingView. Per ulteriori informazioni, consultare i Termini di utilizzo.
📌 New analysis published daily
🔔 Follow this profile for real-time updates
⚠️ This is personal analysis, not financial advice
Daily GOLD and Forex updates: t.me/+SOSI26CZOJ1mZDhl
🔔 Follow this profile for real-time updates
⚠️ This is personal analysis, not financial advice
Daily GOLD and Forex updates: t.me/+SOSI26CZOJ1mZDhl
Pubblicazioni correlate
Declinazione di responsabilità
Le informazioni e le pubblicazioni non sono intese come, e non costituiscono, consulenza o raccomandazioni finanziarie, di investimento, di trading o di altro tipo fornite o approvate da TradingView. Per ulteriori informazioni, consultare i Termini di utilizzo.