
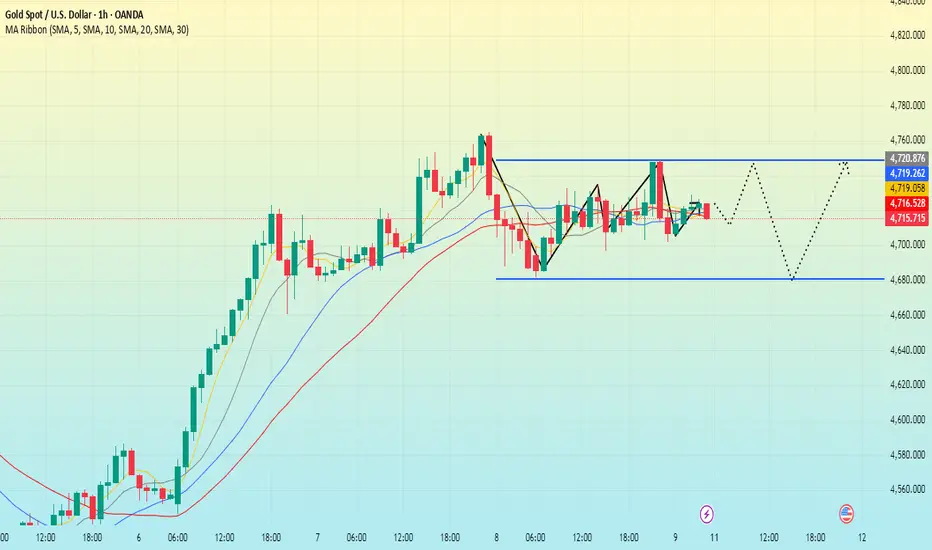
From a technical analysis perspective, the price continues to stabilize, finding support at the middle band of the Bollinger Bands. The Bollinger Bands channel is gradually narrowing, signaling a contraction in short-term market volatility.
The 1-hour chart reveals that after surging to a high of 4764.7 and subsequently pulling back, the price touched 4750 again on Friday before retreating once more. While bullish momentum has shown signs of waning, the downside correction remains limited. Consequently, the market is expected to continue oscillating at elevated levels in the short term, awaiting fundamental news or capital flows to provide the catalyst needed to break out of this trading range.
Key support levels to watch are in the $4680–$4700 range, while resistance levels are situated between $4750 and $4780.
In summary, gold is highly likely to continue oscillating within the $4680–$4750 range in the short term. Should the price firmly establish itself above $4750, the bullish trend would resume, targeting the $4800–$4850 zone; conversely, a breakdown below the $4680 support level would trigger a corrective phase, testing the $4630–$4600 range.
More Strategies ➤➤➤➤➤➤➤➤◍
The 1-hour chart reveals that after surging to a high of 4764.7 and subsequently pulling back, the price touched 4750 again on Friday before retreating once more. While bullish momentum has shown signs of waning, the downside correction remains limited. Consequently, the market is expected to continue oscillating at elevated levels in the short term, awaiting fundamental news or capital flows to provide the catalyst needed to break out of this trading range.
Key support levels to watch are in the $4680–$4700 range, while resistance levels are situated between $4750 and $4780.
In summary, gold is highly likely to continue oscillating within the $4680–$4750 range in the short term. Should the price firmly establish itself above $4750, the bullish trend would resume, targeting the $4800–$4850 zone; conversely, a breakdown below the $4680 support level would trigger a corrective phase, testing the $4630–$4600 range.
More Strategies ➤➤➤➤➤➤➤➤◍

Declinazione di responsabilità
Le informazioni e le pubblicazioni non sono intese come, e non costituiscono, consulenza o raccomandazioni finanziarie, di investimento, di trading o di altro tipo fornite o approvate da TradingView. Per ulteriori informazioni, consultare i Termini di utilizzo.
Declinazione di responsabilità
Le informazioni e le pubblicazioni non sono intese come, e non costituiscono, consulenza o raccomandazioni finanziarie, di investimento, di trading o di altro tipo fornite o approvate da TradingView. Per ulteriori informazioni, consultare i Termini di utilizzo.