
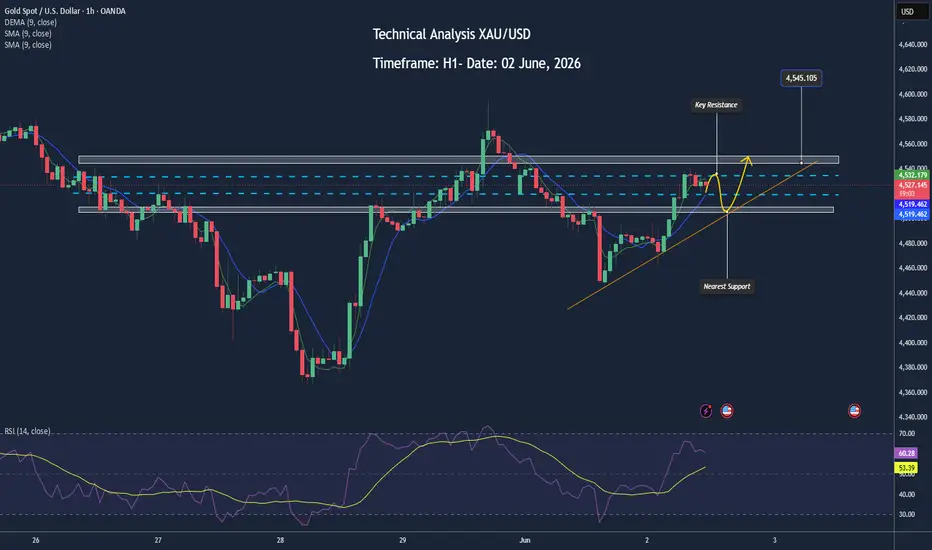
📊 Market Overview:
After a strong rally from below 4,500 to the 4,530 area, gold is currently moving sideways around 4,525 USD/oz. This is a normal market behavior following a sharp advance, as the market temporarily balances between profit-taking from existing buyers and fresh buying interest from new participants.
The fact that gold has not experienced a significant pullback after such a strong rally suggests that buyers remain in control of the market.
📉 Technical Analysis:
Key Resistance:
• 4,532 – 4,535
• 4,545 – 4,550
Nearest Support:
• 4,518 – 4,520
• 4,505 – 4,510
• EMA:
Price remains above both EMA 09 and EMA 20, confirming that the short-term bullish trend remains intact.
Candlestick / Volume / Momentum:
• A series of small candles indicates that the market is currently consolidating.
• Trading volume has gradually declined compared to the breakout phase, which is typical during a pause before the next move.
• No strong bearish reversal patterns such as a Bearish Engulfing or Evening Star have appeared.
• The longer the market remains sideways above 4,520, the higher the probability of another upward breakout.
📌 Outlook:
A positive sign is that gold is consolidating near its recent highs rather than experiencing a sharp decline after the rally. This is often considered a sign of a strong bullish trend.
💡 Suggested Trading Strategy:
🔻 SELL XAU/USD
Entry: 4,542 – 4,547
🎯 TP: 40 / 80 / 200 pips
❌ SL: 4,550
🔺 BUY XAU/USD
Entry: 4,518 – 4,522
🎯 TP: 40 / 80 / 200 pips
❌ SL: 4,515
After a strong rally from below 4,500 to the 4,530 area, gold is currently moving sideways around 4,525 USD/oz. This is a normal market behavior following a sharp advance, as the market temporarily balances between profit-taking from existing buyers and fresh buying interest from new participants.
The fact that gold has not experienced a significant pullback after such a strong rally suggests that buyers remain in control of the market.
📉 Technical Analysis:
Key Resistance:
• 4,532 – 4,535
• 4,545 – 4,550
Nearest Support:
• 4,518 – 4,520
• 4,505 – 4,510
• EMA:
Price remains above both EMA 09 and EMA 20, confirming that the short-term bullish trend remains intact.
Candlestick / Volume / Momentum:
• A series of small candles indicates that the market is currently consolidating.
• Trading volume has gradually declined compared to the breakout phase, which is typical during a pause before the next move.
• No strong bearish reversal patterns such as a Bearish Engulfing or Evening Star have appeared.
• The longer the market remains sideways above 4,520, the higher the probability of another upward breakout.
📌 Outlook:
A positive sign is that gold is consolidating near its recent highs rather than experiencing a sharp decline after the rally. This is often considered a sign of a strong bullish trend.
💡 Suggested Trading Strategy:
🔻 SELL XAU/USD
Entry: 4,542 – 4,547
🎯 TP: 40 / 80 / 200 pips
❌ SL: 4,550
🔺 BUY XAU/USD
Entry: 4,518 – 4,522
🎯 TP: 40 / 80 / 200 pips
❌ SL: 4,515
Trade attivo
Trade chiuso: obiettivo raggiunto

📊 Forex | Gold | Crypto Market Insights
📰 Real-time news updates & expert analysis
💡 Technical breakdowns & market outlooks
🔗 Join our free group: telegram.me/+DmS-dVFJMm40MDM9
📰 Real-time news updates & expert analysis
💡 Technical breakdowns & market outlooks
🔗 Join our free group: telegram.me/+DmS-dVFJMm40MDM9
Pubblicazioni correlate
Declinazione di responsabilità
Le informazioni e le pubblicazioni non sono intese come, e non costituiscono, consulenza o raccomandazioni finanziarie, di investimento, di trading o di altro tipo fornite o approvate da TradingView. Per ulteriori informazioni, consultare i Termini di utilizzo.
📊 Forex | Gold | Crypto Market Insights
📰 Real-time news updates & expert analysis
💡 Technical breakdowns & market outlooks
🔗 Join our free group: telegram.me/+DmS-dVFJMm40MDM9
📰 Real-time news updates & expert analysis
💡 Technical breakdowns & market outlooks
🔗 Join our free group: telegram.me/+DmS-dVFJMm40MDM9
Pubblicazioni correlate
Declinazione di responsabilità
Le informazioni e le pubblicazioni non sono intese come, e non costituiscono, consulenza o raccomandazioni finanziarie, di investimento, di trading o di altro tipo fornite o approvate da TradingView. Per ulteriori informazioni, consultare i Termini di utilizzo.