
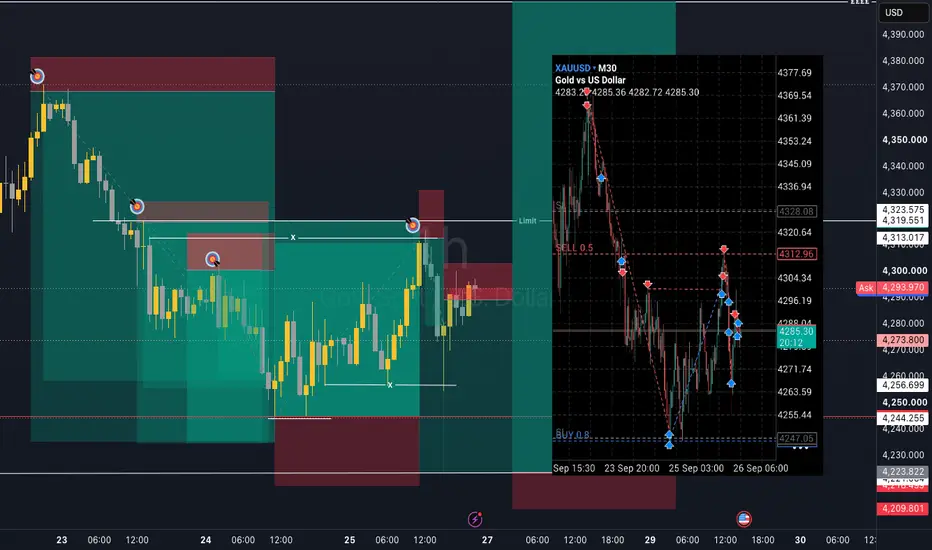
XAUUSD TRADE BREAKDOWN
Advanced Liquidity • Higher Timeframe Narrative • Precision Execution
Let’s break down this week’s trading from start to finish.
Not simply the entries.
Not simply the profits.
Not simply the winning trades.
We are going to break down the entire narrative of the market how the higher timeframe created the destination, how liquidity was engineered, how traders were induced and trapped, how the lower timeframes provided the execution, and how the trades were managed once they were live.
This was a week of multiple opportunities, but more importantly, it was a week that demonstrated how liquidity, structure, narrative and execution can work together as one repeatable process.
This wasn't prediction.
It wasn't guesswork.
And it certainly wasn't seeing one bearish candle and deciding to sell.
Every major decision came from a combination of:
Liquidity.
Market structure.
Inducement.
Trapped traders.
Higher timeframe targets.
Order flow.
Price action.
Confirmation.
Defined invalidation.
So let's go back to where the analysis started and walk through the entire story.
START WITH THE 15 MINUTE TIMEFRAME
In order to properly understand this trade, we first need to start on the 15 minute timeframe.

Here we can see the extreme sell side and buy side liquidity that had been marked following Gold's bullish expansion.
At this stage, both the lower and higher timeframes were beginning to present a bearish narrative, with price printing:
Lower highs.
Lower lows.
Bearish structure.
That immediately gives us something important.
We have a bearish environment.
But direction alone isn't enough.
We still need to understand:
Where is price actually trying to go?

The higher timeframe sell side liquidity had not yet been taken.
That becomes extremely important.
Because if liquidity remains untouched below price, we have a potential destination.
The market has already shown us where liquidity exists.
Our job is now to determine whether price has a reason to travel toward it.
So now we move up to the 4 hour timeframe.

Here we had a significant bullish expansion on the 4 hour chart.
But that bullish expansion also created something extremely important:
Internal sell side liquidity.
We can see Gold interacting with these lows and using them to build liquidity.
As price approached the lows, buyers stepped back into the market after those lows were swept, producing another bullish reaction.
At first glance, that can look like bullish strength.
But this is where the deeper analysis begins.
We don't simply ask:
Did price bounce
We ask:
What did that bounce actually accomplish?

This was a move that helped build internal sell side liquidity.
Why?
Look at the low that produced the bullish reaction.
Price came down and respected that low.
It did not properly sweep it.
That means liquidity was still sitting underneath.
So any bullish move that develops above that low has not necessarily completed the liquidity objective.
The market may simply be building more liquidity underneath price.

And this gives us something extremely important:
A higher timeframe target for sells inside an already bearish market.
Now the bigger picture starts to become clear.
The market is bearish.
The 4 hour chart has unfinished sell side liquidity.
And we have a clear higher timeframe destination.
Now we return to the 15 minute chart and begin building the execution model.
BACK TO THE 15 MINUTE
Now we can start painting the picture.
After taking out the lows, Gold moves aggressively bullish and begins taking internal buy side liquidity.
But pay close attention to what happens when price eventually begins to sell off.
It does not take the high created by the previous bearish move.
That means liquidity is still sitting above.
And if liquidity is still resting there, we need to respect it.

This sell off is therefore not necessarily the move we want to sell.
Instead, it is collecting liquidity from the newly created lows and helping build even more liquidity for the eventual bearish move.
This is where understanding the narrative becomes critical.
We don't simply react to the candle directly in front of us.
We ask:
What liquidity has been taken?
What liquidity remains?
Who is being trapped?
Where is price likely to go next?

After taking the lows from the internal structure, we can see buyers stepping back into the market.
But they fail to expand.
Instead, price becomes choppy and begins consolidating.
This is exactly the type of environment where we need to pay attention.
Why?
Because failed expansion can create trapped participants.
And when we already have a higher timeframe bearish target, that consolidation can become the preparation for the next move.
This is where we planned our sell.

Now we look left.
We can see that the previous high was swept, taking liquidity.
That move created an order block and an imbalance/FVG.
It also gave us a protected high.
That protected high becomes extremely important because it gives us a clear structural point of invalidation.
In other words:
We don't simply have an entry.
We have a reason for the entry.
And we have a structural reason for the stop loss.

Next, we return to current price action and identify where buy side liquidity is still resting.
That liquidity needs to be taken before we can confidently look for the sell.
This is one of the most important lessons from the entire trade.
The market can give you the correct direction and still give you the wrong entry.
So instead of chasing the bearish move, we wait for the market to complete the liquidity objective first.

With all of this marked, the trade was planned.
At this point, there was nothing left to predict.
We simply had to wait.

Price broke out exactly as expected, moving bullishly toward the buy side liquidity.
And this was the plan that had already been laid out.

We had an entry at 4364, positioned just before the sweep of the final wick into the imbalance.
The reason the entry was placed ahead of the wick was simple:
Different brokers, spreads and fills can produce slightly different prices.
By positioning the entry ahead of the wick, we increased the likelihood that everyone could participate in the planned setup.
We also had a limit order at 4369.
This represented the 15 minute supply zone and imbalance fill.
Our stop loss was placed above the protected highs.
Again, everything had a reason.
Nothing was arbitrary.
THIS IS WHERE PATIENCE MATTERS
Price came close to our entry and began to reverse.
This is where many traders make an emotional decision.
They see price approaching their AOI.
They see it beginning to reverse.
And they think:
I need to get in now.
But that's exactly what we don't do.
Because what was happening was actually what we wanted to see.
Why?
Because price making a high and reversing without taking the liquidity meant the liquidity was still sitting there.
It had not been cleared.
That meant early sellers could become trapped.
And those trapped sellers would eventually provide even more liquidity for the real move.
We didn't need to chase them.
We simply needed to wait for the market to take them out.
Sweep the liquidity.
Clear the sellers.
Then enter the real move.

And that's exactly what happened.
Price tagged both entries, swept the liquidity and immediately expanded into profit.
At this point, we closed our lowest entry to remove risk and banked a small amount of profit from a position that was already working.
The objective was no longer simply to enter.
The objective was now to manage the position and allow the higher timeframe idea to play out.


Now that we were active in the trade, our attention moved toward the sell side liquidity targets.
These targets had already been projected in advance.
They weren't random take profit levels.
They represented areas where price could potentially interact with liquidity and therefore gave us logical locations for:
Break even management.
Partial profits.
Trade management.
Potential continuation.

And the trade continued to develop according to the narrative.

Before long, we were deep in profit and the position was completely risk free.
From here, the market was simply allowed to continue working toward the larger liquidity objective.
LET'S RECAP THE ENTIRE NARRATIVE
Now let's step back and look at what actually happened.
Well in advance, we called out the bearish price action and explained exactly what we needed to see before looking for a sell.
THE 15 MINUTE CHART
We had bearish price action developing, creating:
Lower lows.
Lower highs.
Bearish structure.
Price then took out some internal liquidity before producing a small reversal.
But this was NOT a market shift.
Instead, price began creating shor term bullish price action while continuing to take internal liquidity.
And this is where understanding liquidity becomes critical.
WHAT DOES THIS DO?
It creates more sell side liquidity.
Once that liquidity was built, buyers were induced into the move.
Buyers began participating.
Sellers then attempted to step back in around the highs.
Those sellers became trapped.
So what happened next?
Because we had already pre marked where the liquidity was sitting, we knew exactly what we were waiting for.
Those early sellers were simply helping to build even more liquidity for the eventual move.
We didn't chase.
We waited.
Once those sellers were taken out and the liquidity was cleared, then we entered.
And once that liquidity objective was completed, price had a clear path toward the sell side target.
This is the difference between simply seeing a bearish candle and actually understanding why the market is moving the way it is.
We weren't guessing.
We had:
Liquidity mapped.
Market structure identified.
The higher timeframe target established.
Inducement identified.
Trapped traders identified.
Entry areas marked.
Invalidation defined.
Confirmation awaited.
Then we allowed price to confirm the idea.
THE STORY DIDN'T END AT ENTRY
As price developed, we began taking out the internal lows created during the bullish move.
Once again, buyers stepped into the market.
But again, we understood the context.
This was not a reversal.
Why?
Because the 15 minute lows had still not been invalidated, and more importantly, our 4 hour sell side liquidity target was still sitting below.
Therefore, any bullish price action at this stage could simply be interpreted as a pullback within the larger bearish structure.
We remained bearish.
We had clean bearish price action and bearish market structure.
Therefore, this pullback wasn't something to fear.
It was another potential opportunity to look for an entry.
So once again, we returned to the same process:
Where is liquidity resting?
Where has liquidity already been taken?
Where could price react?


We marked the relevant equal highs, the imbalance sitting above them, and the supply zone where liquidity had previously been taken.
Everything was mapped.
There was no need to predict what happened next.
All we had to do was wait for price action.


The importance of a plan is that it frees up your time.
We were at break even and allowing the trade to do its thing.
Later, we came back to see the performance.

Gold had entered a stage of consolidation.
This is a significant phase.
As price accumulates, we can look deeper into the chart for another opportunity before the manipulation phase transitions into distribution while keeping the same sell narrative.
Above the consolidation on the 1 hour timeframe, an imbalance was left with a supply zone above it.

A new trade was sent out.

At the same time, we began looking at the higher timeframes and comparing Gold against DXY.
GOLD

Here we can see our target and AOI.
But as we look deeper, we can also see that the last low that came into the zone was absorbed.
This broke a bearish trend line that had not yet been retested.
Applying a Fibonacci measurement gave us a golden zone that Gold was trading inside.

Keeping the narrative of we need to take the sell side liquidity before we can move toward buy side liquidity, a longer term idea was put out to the group.

DXY

Here we can see DXY had engineered liquidity inside a bullish channel before a significant sell off.
Now, unlike Gold, DXY was taking out its internal buy side liquidity, leaving behind sell side targets and equal lows at the bottom.
More importantly, as DXY swept its last high, it was moving into a higher timeframe FVG and a supply zone.
This meant Gold was approaching an AOI for potential reversal while DXY was simultaneously approaching an area of potential resistance.
As price action developed, this buy trade was sent out.
But we were not going to target extreme highs just yet.
We had no confirmed shift.
We had nothing confirming that this AOI would be the bottom.
What we did have was a need for a pullback and a reason to continue seeking liquidity.

At this point, we had further analysis and two trades pending just before market close.
Let's fast forward.


At this point, there were two successful sell entries leading into the buy.
The position was managed by closing the highest entry just before the buy activated, leaving the lower position to continue expanding toward its target.
The buy activated and immediately moved into profit while, at the same time, DXY was rejecting from supply.


Before long, Gold started to reverse.
As price approached break even, we were not ready to allow this trade to be taken out at break even yet.
The group was updated to hold the trade.

Price action rejected the entry again.


A NEW DAY FRIDAY
Friday is here.
The final trading day of the week.
And once again, we begin by looking deeper into the charts.

LET'S LOOK AT GOLD.
Across the higher timeframes, the picture remains bearish.
We have seen very strong bearish momentum throughout the week, and that context has not changed.
Now this is where things become important.
Price has now taken out the internal structure lows, clearing sell side liquidity and pushing into an area we had already identified as important:
An extreme low.
A liquidity block.
A support zone.
As price enters this area, buyers are repeatedly stepping in and absorbing some of that bearish momentum.
This is now the second time we have bounced from this area, with buyers attempting to reclaim price.
But this is where discipline matters.
We have to remember why we sold in the first place.
There is still liquidity sitting underneath the low.
The fact that buyers are stepping in does not automatically mean price has confirmed a reversal.
The overall structure is still bearish.
The momentum is still bearish.
The sell side liquidity underneath the low is still relevant.
So what are we actually seeing?
A consolidation phase.
Price is now compressing around this area while building liquidity.
And we already know what we look for when price enters this type of phase.
AMD
Accumulation.
Manipulation.
Distribution.
The buyers stepping in don't automatically invalidate the bearish narrative.
They may simply be part of the process of building the liquidity required for the next move.
So rather than guessing:
We wait.
We watch what liquidity gets built.
We wait for the manipulation.
Then we look for the distribution.
This is why understanding the narrative matters.
We don't trade simply because price bounced.
We trade what price shows us next.


NOW LET'S LOOK AT DXY BECAUSE HERE WE ARE SEEING THE REVERSE
While Gold has been working into the lows and taking sell side liquidity, DXY has been doing the opposite.
DXY has taken out its internal sell side liquidity and is now moving back toward the highs.
But those highs are extremely important.
Why?
Because as price approaches that high, we are entering an area where multiple pieces of information come together.
First, we have a higher timeframe FVG sitting directly into the move.
That FVG leads price straight into a higher timeframe supply zone.
Then we have another important piece of information:
Liquidity at the extreme of the high has already been taken.
So price isn't simply approaching a random high.
It is approaching an area where we have:
* Higher timeframe FVG
* Supply
* Previously taken liquidity
* An extreme high
* A potential resistance test
Then we zoom out again.
Moving onto the monthly timeframe, we can see that price previously broke through an area where support had been established.
That same area is now being tested from underneath.
And this is the concept we always need to remember:
Support can become resistance once price breaks through it.
So DXY is now approaching an area where the higher timeframe picture becomes extremely important.
Just like with Gold, we don't simply react because price has arrived at a level.
We observe what price does inside the area.
Does liquidity build?
Do we see manipulation?
Does price reject the zone?
Does bearish price action develop?
Or does DXY reclaim the area and invalidate the idea?
This is why we map the narrative before the move.
Gold is working into extreme lows after taking sell side liquidity.
DXY is working back toward extreme highs after taking internal buy side liquidity.
Now we watch what both markets do at their respective areas.
Levels give us the location.
Liquidity gives us the narrative.
Price action gives us the confirmation.

At this point, price action was nearing our sells breakeven area.
An update was sent out.
This was already anticipated because of where liquidity was sitting, and a new plan was already loaded.

THE 4245 ENTRY
Let's look at our 4245 entry.
Notice how the most recent low respected the previous low.
That is important.
Why?
Because it tells us liquidity is still sitting underneath that first low.
I keep repeating this because this is the part I want you to understand.
We don't just look at the low itself.
We ask:
What liquidity has been left behind?
Now, just like on the higher timeframe, we have a clear target for the sell-side.
4245 becomes important again.
But that's not the only target.
We also have our higher timeframe target sitting underneath it.
So the narrative is clear:
Liquidity beneath the low.
4245 as the next target.
Higher timeframe liquidity underneath.
Bearish market structure.
This is how we build the trade from the liquidity rather than simply chasing the move.


Here we have sell side liquidity to be taken entering a bearish order block.

This trade was sent out with entry at the supply and a limit at the resting liquidity.
We have to remember that all of this started from the higher timeframe.
That is the key.
This is where we identified our target.
This is where we identified the liquidity.
This is where the entire narrative began.
From there, we dropped down to the 15 minute timeframe to find our entry.
And what an entry it was.
But that entry was only the beginning.
Because this isn't just a trade breakdown.
THIS IS THE FULL BREAKDOWN OF A WEEKLY CANDLE
Everything happening inside that weekly candle matters.
The liquidity.
The structure.
The internal price action.
The reactions.
The targets.
The manipulation.
The continuation.
And throughout the entire journey, we have been counting the pips and following the narrative in real time.
We have not missed the story.
Now let's zoom all the way back out.
THE WEEKLY

We are currently looking to close with a strong bearish engulfing candle.
Waiting for price to take out the previous weekly lows.
The previous weekly candle was bullish, yet despite this bearish move, price is still inside the previous weekly candle's range.
There has been no confirmed breakout to either side of that weekly range yet.
And that distinction matters.
Because when we zoom out, we can see that everything we have been analysing on the lower timeframes is ultimately playing out inside the bigger weekly structure.
This is the difference between simply watching a trade move...
And understanding the entire narrative behind the move.
We need the week to close.
But notice that I had 4403 marked out from the start of the week as a liquidity point.
It now looks to be developing into a weekly engulfing structure.
Gold cannot become bullish until price action holds above this area.

Our entry hit with the second limit still pending.
We confirmed the move on the 1 minute and 3 minute timeframes, before also giving the 15 minute confirmation trade.

Price action had to remain under 4297 to continue its bearish path.
The 15 minute timeframe left an imbalance that we could target from the lower timeframe support.


Price tapped in perfectly and sellers stepped in.
Now all that was needed was a close under 4300, failing the bullish engulfing candle, followed by a close under the lower timeframe support at 4297.
This happened.

But we had to await the 30 minute close to confirm it further by having the 30 minute candle also fail the engulfing candle.

Once it closed, the drop was instant.

At this point, we were break even and risk free, with the pending sell still active when this was sent out.

On the 1 hour timeframe, we had now experienced a pullback that produced a change in character, taking out the previous daily high and closing back underneath it.
This left a zone and equal lows for buyers to potentially step back into the market.

The target was this inverse fair value gap.

Price swept the equal lows as expected and then accelerated back upward with momentum.
This trade was sent out.

THE MASTERCLASS WHAT THIS WEEK ACTUALLY TAUGHT
If you look at this week as a collection of individual trades, you miss the most important part.
The real lesson wasn't:
We sold Gold.
The real lesson wasn't:
The trade made X amount of pips.
And it wasn't even the individual entries.
The real lesson was the process that connected every trade.
We started with the higher timeframe.
We identified the unfinished liquidity.
We established the larger destination.
We dropped down to the 15-minute timeframe.
We studied the internal structure.
We identified inducement.
We identified trapped traders.
We identified where liquidity was being built.
We marked the order blocks.
We marked the imbalances.
We defined the protected highs.
We defined invalidation.
Then we waited.
We didn't chase the move.
We waited for liquidity to be taken.
We waited for price action to confirm.
Then we executed.
And once we were in the trade, the work didn't stop.
We managed risk.
We removed exposure.
We protected positions.
We allowed runners to continue.
We reassessed the narrative as price developed.
When Gold entered consolidation, we didn't abandon the original analysis simply because price bounced.
We recognised the possibility of AMD accumulation, manipulation and distribution.
When Gold approached the lows, we compared it with DXY.
When DXY approached its higher timeframe supply, we used that information as additional context.
When price created new liquidity, we mapped it.
When liquidity was taken, we reassessed.
When structure changed, we responded.
And when confirmation arrived, we acted.
That is the difference between having a trade idea and having a trading framework.
THE COMPLETE PROCESS
This week's trading can be reduced to one simple sequence:
1. HIGHER TIMEFRAME
Find the larger narrative.
Where is price?
What structure are we in?
Where is the untouched liquidity?
What is the likely destination?
2. LIQUIDITY
Identify what has already been taken.
Then identify what remains.
Look for:
Equal highs.
Equal lows.
Internal liquidity.
External liquidity.
Engineered liquidity.
Resting liquidity.
3. STRUCTURE
Determine whether the market is actually changing structure or simply producing a pullback.
A small reversal does not automatically equal a market shift.
Context matters.
4. INDUCEMENT
Ask who is being attracted into the market.
Who is buying?
Who is selling?
Where are their stops likely to be?
Where is liquidity being created?
5. AOI
Once the narrative is established, identify the area where the trade can actually be executed.
Supply.
Demand.
Order block.
FVG.
iFVG.
Liquidity block.
Golden zone.
Structure.
6. CONFIRMATION
We don't need to predict.
We wait for price to show us.
Lower timeframe confirmation.
Engulfing candles.
Structure breaks.
Reactions.
Liquidity sweeps.
Failed expansions.
7. EXECUTION
Defined entry.
Defined stop.
Defined invalidation.
Defined targets.
No emotional chasing.
8. MANAGEMENT
Once the trade is working:
Reduce exposure.
Protect capital.
Take partials where appropriate.
Move to risk free when justified.
Allow the remaining position to work toward the larger objective.
9. REASSESSMENT
The market doesn't owe us the original path.
If new information appears, we reassess.
If structure changes, we adapt.
If liquidity changes, the narrative changes.
10. ZOOM OUT
Never forget the timeframe above your trade.
The 1 minute chart can give you the entry.
The 15 minute can give you the setup.
The 1 hour can give you the structure.
The 4 hour can give you the destination.
The weekly can tell you what the entire move actually means.
THE FINAL LESSON
This week wasn't about one perfect entry.
It was about repeatedly applying the same framework to different conditions.
Higher timeframe vision.
Lower timeframe execution.
Liquidity before entry.
Structure before bias.
Confirmation before execution.
Defined risk before reward.
And most importantly:
We don't trade what we want to happen.
We trade what price shows us.
A level gives you a location.
Liquidity gives you a reason.
Structure gives you context.
Price action gives you confirmation.
Risk management keeps you in the game.
And the higher timeframe keeps you from getting lost in the noise.
That is the entire philosophy behind this week's trading.
Not prediction.
Not chasing.
Not guessing.
Planning.
Waiting.
Confirming.
Executing.
Managing.
And allowing the market to tell the story.
Because once you understand the story...
the candles stop being random.
The liquidity stops being random.
The pullbacks stop being random.
And the trade becomes the final execution of a narrative that was already visible before price made the move.
Advanced Liquidity • Higher Timeframe Narrative • Precision Execution
Let’s break down this week’s trading from start to finish.
Not simply the entries.
Not simply the profits.
Not simply the winning trades.
We are going to break down the entire narrative of the market how the higher timeframe created the destination, how liquidity was engineered, how traders were induced and trapped, how the lower timeframes provided the execution, and how the trades were managed once they were live.
This was a week of multiple opportunities, but more importantly, it was a week that demonstrated how liquidity, structure, narrative and execution can work together as one repeatable process.
This wasn't prediction.
It wasn't guesswork.
And it certainly wasn't seeing one bearish candle and deciding to sell.
Every major decision came from a combination of:
Liquidity.
Market structure.
Inducement.
Trapped traders.
Higher timeframe targets.
Order flow.
Price action.
Confirmation.
Defined invalidation.
So let's go back to where the analysis started and walk through the entire story.
START WITH THE 15 MINUTE TIMEFRAME
In order to properly understand this trade, we first need to start on the 15 minute timeframe.
Here we can see the extreme sell side and buy side liquidity that had been marked following Gold's bullish expansion.
At this stage, both the lower and higher timeframes were beginning to present a bearish narrative, with price printing:
Lower highs.
Lower lows.
Bearish structure.
That immediately gives us something important.
We have a bearish environment.
But direction alone isn't enough.
We still need to understand:
Where is price actually trying to go?
The higher timeframe sell side liquidity had not yet been taken.
That becomes extremely important.
Because if liquidity remains untouched below price, we have a potential destination.
The market has already shown us where liquidity exists.
Our job is now to determine whether price has a reason to travel toward it.
So now we move up to the 4 hour timeframe.
Here we had a significant bullish expansion on the 4 hour chart.
But that bullish expansion also created something extremely important:
Internal sell side liquidity.
We can see Gold interacting with these lows and using them to build liquidity.
As price approached the lows, buyers stepped back into the market after those lows were swept, producing another bullish reaction.
At first glance, that can look like bullish strength.
But this is where the deeper analysis begins.
We don't simply ask:
Did price bounce
We ask:
What did that bounce actually accomplish?
This was a move that helped build internal sell side liquidity.
Why?
Look at the low that produced the bullish reaction.
Price came down and respected that low.
It did not properly sweep it.
That means liquidity was still sitting underneath.
So any bullish move that develops above that low has not necessarily completed the liquidity objective.
The market may simply be building more liquidity underneath price.
And this gives us something extremely important:
A higher timeframe target for sells inside an already bearish market.
Now the bigger picture starts to become clear.
The market is bearish.
The 4 hour chart has unfinished sell side liquidity.
And we have a clear higher timeframe destination.
Now we return to the 15 minute chart and begin building the execution model.
BACK TO THE 15 MINUTE
Now we can start painting the picture.
After taking out the lows, Gold moves aggressively bullish and begins taking internal buy side liquidity.
But pay close attention to what happens when price eventually begins to sell off.
It does not take the high created by the previous bearish move.
That means liquidity is still sitting above.
And if liquidity is still resting there, we need to respect it.
This sell off is therefore not necessarily the move we want to sell.
Instead, it is collecting liquidity from the newly created lows and helping build even more liquidity for the eventual bearish move.
This is where understanding the narrative becomes critical.
We don't simply react to the candle directly in front of us.
We ask:
What liquidity has been taken?
What liquidity remains?
Who is being trapped?
Where is price likely to go next?
After taking the lows from the internal structure, we can see buyers stepping back into the market.
But they fail to expand.
Instead, price becomes choppy and begins consolidating.
This is exactly the type of environment where we need to pay attention.
Why?
Because failed expansion can create trapped participants.
And when we already have a higher timeframe bearish target, that consolidation can become the preparation for the next move.
This is where we planned our sell.
Now we look left.
We can see that the previous high was swept, taking liquidity.
That move created an order block and an imbalance/FVG.
It also gave us a protected high.
That protected high becomes extremely important because it gives us a clear structural point of invalidation.
In other words:
We don't simply have an entry.
We have a reason for the entry.
And we have a structural reason for the stop loss.
Next, we return to current price action and identify where buy side liquidity is still resting.
That liquidity needs to be taken before we can confidently look for the sell.
This is one of the most important lessons from the entire trade.
The market can give you the correct direction and still give you the wrong entry.
So instead of chasing the bearish move, we wait for the market to complete the liquidity objective first.
With all of this marked, the trade was planned.
At this point, there was nothing left to predict.
We simply had to wait.
Price broke out exactly as expected, moving bullishly toward the buy side liquidity.
And this was the plan that had already been laid out.
We had an entry at 4364, positioned just before the sweep of the final wick into the imbalance.
The reason the entry was placed ahead of the wick was simple:
Different brokers, spreads and fills can produce slightly different prices.
By positioning the entry ahead of the wick, we increased the likelihood that everyone could participate in the planned setup.
We also had a limit order at 4369.
This represented the 15 minute supply zone and imbalance fill.
Our stop loss was placed above the protected highs.
Again, everything had a reason.
Nothing was arbitrary.
THIS IS WHERE PATIENCE MATTERS
Price came close to our entry and began to reverse.
This is where many traders make an emotional decision.
They see price approaching their AOI.
They see it beginning to reverse.
And they think:
I need to get in now.
But that's exactly what we don't do.
Because what was happening was actually what we wanted to see.
Why?
Because price making a high and reversing without taking the liquidity meant the liquidity was still sitting there.
It had not been cleared.
That meant early sellers could become trapped.
And those trapped sellers would eventually provide even more liquidity for the real move.
We didn't need to chase them.
We simply needed to wait for the market to take them out.
Sweep the liquidity.
Clear the sellers.
Then enter the real move.
And that's exactly what happened.
Price tagged both entries, swept the liquidity and immediately expanded into profit.
At this point, we closed our lowest entry to remove risk and banked a small amount of profit from a position that was already working.
The objective was no longer simply to enter.
The objective was now to manage the position and allow the higher timeframe idea to play out.
Now that we were active in the trade, our attention moved toward the sell side liquidity targets.
These targets had already been projected in advance.
They weren't random take profit levels.
They represented areas where price could potentially interact with liquidity and therefore gave us logical locations for:
Break even management.
Partial profits.
Trade management.
Potential continuation.
And the trade continued to develop according to the narrative.
Before long, we were deep in profit and the position was completely risk free.
From here, the market was simply allowed to continue working toward the larger liquidity objective.
LET'S RECAP THE ENTIRE NARRATIVE
Now let's step back and look at what actually happened.
Well in advance, we called out the bearish price action and explained exactly what we needed to see before looking for a sell.
THE 15 MINUTE CHART
We had bearish price action developing, creating:
Lower lows.
Lower highs.
Bearish structure.
Price then took out some internal liquidity before producing a small reversal.
But this was NOT a market shift.
Instead, price began creating shor term bullish price action while continuing to take internal liquidity.
And this is where understanding liquidity becomes critical.
WHAT DOES THIS DO?
It creates more sell side liquidity.
Once that liquidity was built, buyers were induced into the move.
Buyers began participating.
Sellers then attempted to step back in around the highs.
Those sellers became trapped.
So what happened next?
Because we had already pre marked where the liquidity was sitting, we knew exactly what we were waiting for.
Those early sellers were simply helping to build even more liquidity for the eventual move.
We didn't chase.
We waited.
Once those sellers were taken out and the liquidity was cleared, then we entered.
And once that liquidity objective was completed, price had a clear path toward the sell side target.
This is the difference between simply seeing a bearish candle and actually understanding why the market is moving the way it is.
We weren't guessing.
We had:
Liquidity mapped.
Market structure identified.
The higher timeframe target established.
Inducement identified.
Trapped traders identified.
Entry areas marked.
Invalidation defined.
Confirmation awaited.
Then we allowed price to confirm the idea.
THE STORY DIDN'T END AT ENTRY
As price developed, we began taking out the internal lows created during the bullish move.
Once again, buyers stepped into the market.
But again, we understood the context.
This was not a reversal.
Why?
Because the 15 minute lows had still not been invalidated, and more importantly, our 4 hour sell side liquidity target was still sitting below.
Therefore, any bullish price action at this stage could simply be interpreted as a pullback within the larger bearish structure.
We remained bearish.
We had clean bearish price action and bearish market structure.
Therefore, this pullback wasn't something to fear.
It was another potential opportunity to look for an entry.
So once again, we returned to the same process:
Where is liquidity resting?
Where has liquidity already been taken?
Where could price react?
We marked the relevant equal highs, the imbalance sitting above them, and the supply zone where liquidity had previously been taken.
Everything was mapped.
There was no need to predict what happened next.
All we had to do was wait for price action.
The importance of a plan is that it frees up your time.
We were at break even and allowing the trade to do its thing.
Later, we came back to see the performance.
Gold had entered a stage of consolidation.
This is a significant phase.
As price accumulates, we can look deeper into the chart for another opportunity before the manipulation phase transitions into distribution while keeping the same sell narrative.
Above the consolidation on the 1 hour timeframe, an imbalance was left with a supply zone above it.
A new trade was sent out.
At the same time, we began looking at the higher timeframes and comparing Gold against DXY.
GOLD
Here we can see our target and AOI.
But as we look deeper, we can also see that the last low that came into the zone was absorbed.
This broke a bearish trend line that had not yet been retested.
Applying a Fibonacci measurement gave us a golden zone that Gold was trading inside.
Keeping the narrative of we need to take the sell side liquidity before we can move toward buy side liquidity, a longer term idea was put out to the group.
DXY
Here we can see DXY had engineered liquidity inside a bullish channel before a significant sell off.
Now, unlike Gold, DXY was taking out its internal buy side liquidity, leaving behind sell side targets and equal lows at the bottom.
More importantly, as DXY swept its last high, it was moving into a higher timeframe FVG and a supply zone.
This meant Gold was approaching an AOI for potential reversal while DXY was simultaneously approaching an area of potential resistance.
As price action developed, this buy trade was sent out.
But we were not going to target extreme highs just yet.
We had no confirmed shift.
We had nothing confirming that this AOI would be the bottom.
What we did have was a need for a pullback and a reason to continue seeking liquidity.
At this point, we had further analysis and two trades pending just before market close.
Let's fast forward.
At this point, there were two successful sell entries leading into the buy.
The position was managed by closing the highest entry just before the buy activated, leaving the lower position to continue expanding toward its target.
The buy activated and immediately moved into profit while, at the same time, DXY was rejecting from supply.
Before long, Gold started to reverse.
As price approached break even, we were not ready to allow this trade to be taken out at break even yet.
The group was updated to hold the trade.
Price action rejected the entry again.
A NEW DAY FRIDAY
Friday is here.
The final trading day of the week.
And once again, we begin by looking deeper into the charts.
LET'S LOOK AT GOLD.
Across the higher timeframes, the picture remains bearish.
We have seen very strong bearish momentum throughout the week, and that context has not changed.
Now this is where things become important.
Price has now taken out the internal structure lows, clearing sell side liquidity and pushing into an area we had already identified as important:
An extreme low.
A liquidity block.
A support zone.
As price enters this area, buyers are repeatedly stepping in and absorbing some of that bearish momentum.
This is now the second time we have bounced from this area, with buyers attempting to reclaim price.
But this is where discipline matters.
We have to remember why we sold in the first place.
There is still liquidity sitting underneath the low.
The fact that buyers are stepping in does not automatically mean price has confirmed a reversal.
The overall structure is still bearish.
The momentum is still bearish.
The sell side liquidity underneath the low is still relevant.
So what are we actually seeing?
A consolidation phase.
Price is now compressing around this area while building liquidity.
And we already know what we look for when price enters this type of phase.
AMD
Accumulation.
Manipulation.
Distribution.
The buyers stepping in don't automatically invalidate the bearish narrative.
They may simply be part of the process of building the liquidity required for the next move.
So rather than guessing:
We wait.
We watch what liquidity gets built.
We wait for the manipulation.
Then we look for the distribution.
This is why understanding the narrative matters.
We don't trade simply because price bounced.
We trade what price shows us next.
NOW LET'S LOOK AT DXY BECAUSE HERE WE ARE SEEING THE REVERSE
While Gold has been working into the lows and taking sell side liquidity, DXY has been doing the opposite.
DXY has taken out its internal sell side liquidity and is now moving back toward the highs.
But those highs are extremely important.
Why?
Because as price approaches that high, we are entering an area where multiple pieces of information come together.
First, we have a higher timeframe FVG sitting directly into the move.
That FVG leads price straight into a higher timeframe supply zone.
Then we have another important piece of information:
Liquidity at the extreme of the high has already been taken.
So price isn't simply approaching a random high.
It is approaching an area where we have:
* Higher timeframe FVG
* Supply
* Previously taken liquidity
* An extreme high
* A potential resistance test
Then we zoom out again.
Moving onto the monthly timeframe, we can see that price previously broke through an area where support had been established.
That same area is now being tested from underneath.
And this is the concept we always need to remember:
Support can become resistance once price breaks through it.
So DXY is now approaching an area where the higher timeframe picture becomes extremely important.
Just like with Gold, we don't simply react because price has arrived at a level.
We observe what price does inside the area.
Does liquidity build?
Do we see manipulation?
Does price reject the zone?
Does bearish price action develop?
Or does DXY reclaim the area and invalidate the idea?
This is why we map the narrative before the move.
Gold is working into extreme lows after taking sell side liquidity.
DXY is working back toward extreme highs after taking internal buy side liquidity.
Now we watch what both markets do at their respective areas.
Levels give us the location.
Liquidity gives us the narrative.
Price action gives us the confirmation.
At this point, price action was nearing our sells breakeven area.
An update was sent out.
This was already anticipated because of where liquidity was sitting, and a new plan was already loaded.
THE 4245 ENTRY
Let's look at our 4245 entry.
Notice how the most recent low respected the previous low.
That is important.
Why?
Because it tells us liquidity is still sitting underneath that first low.
I keep repeating this because this is the part I want you to understand.
We don't just look at the low itself.
We ask:
What liquidity has been left behind?
Now, just like on the higher timeframe, we have a clear target for the sell-side.
4245 becomes important again.
But that's not the only target.
We also have our higher timeframe target sitting underneath it.
So the narrative is clear:
Liquidity beneath the low.
4245 as the next target.
Higher timeframe liquidity underneath.
Bearish market structure.
This is how we build the trade from the liquidity rather than simply chasing the move.
Here we have sell side liquidity to be taken entering a bearish order block.
This trade was sent out with entry at the supply and a limit at the resting liquidity.
We have to remember that all of this started from the higher timeframe.
That is the key.
This is where we identified our target.
This is where we identified the liquidity.
This is where the entire narrative began.
From there, we dropped down to the 15 minute timeframe to find our entry.
And what an entry it was.
But that entry was only the beginning.
Because this isn't just a trade breakdown.
THIS IS THE FULL BREAKDOWN OF A WEEKLY CANDLE
Everything happening inside that weekly candle matters.
The liquidity.
The structure.
The internal price action.
The reactions.
The targets.
The manipulation.
The continuation.
And throughout the entire journey, we have been counting the pips and following the narrative in real time.
We have not missed the story.
Now let's zoom all the way back out.
THE WEEKLY
We are currently looking to close with a strong bearish engulfing candle.
Waiting for price to take out the previous weekly lows.
The previous weekly candle was bullish, yet despite this bearish move, price is still inside the previous weekly candle's range.
There has been no confirmed breakout to either side of that weekly range yet.
And that distinction matters.
Because when we zoom out, we can see that everything we have been analysing on the lower timeframes is ultimately playing out inside the bigger weekly structure.
This is the difference between simply watching a trade move...
And understanding the entire narrative behind the move.
We need the week to close.
But notice that I had 4403 marked out from the start of the week as a liquidity point.
It now looks to be developing into a weekly engulfing structure.
Gold cannot become bullish until price action holds above this area.
Our entry hit with the second limit still pending.
We confirmed the move on the 1 minute and 3 minute timeframes, before also giving the 15 minute confirmation trade.
Price action had to remain under 4297 to continue its bearish path.
The 15 minute timeframe left an imbalance that we could target from the lower timeframe support.
Price tapped in perfectly and sellers stepped in.
Now all that was needed was a close under 4300, failing the bullish engulfing candle, followed by a close under the lower timeframe support at 4297.
This happened.
But we had to await the 30 minute close to confirm it further by having the 30 minute candle also fail the engulfing candle.
Once it closed, the drop was instant.
At this point, we were break even and risk free, with the pending sell still active when this was sent out.
On the 1 hour timeframe, we had now experienced a pullback that produced a change in character, taking out the previous daily high and closing back underneath it.
This left a zone and equal lows for buyers to potentially step back into the market.
The target was this inverse fair value gap.
Price swept the equal lows as expected and then accelerated back upward with momentum.
This trade was sent out.
THE MASTERCLASS WHAT THIS WEEK ACTUALLY TAUGHT
If you look at this week as a collection of individual trades, you miss the most important part.
The real lesson wasn't:
We sold Gold.
The real lesson wasn't:
The trade made X amount of pips.
And it wasn't even the individual entries.
The real lesson was the process that connected every trade.
We started with the higher timeframe.
We identified the unfinished liquidity.
We established the larger destination.
We dropped down to the 15-minute timeframe.
We studied the internal structure.
We identified inducement.
We identified trapped traders.
We identified where liquidity was being built.
We marked the order blocks.
We marked the imbalances.
We defined the protected highs.
We defined invalidation.
Then we waited.
We didn't chase the move.
We waited for liquidity to be taken.
We waited for price action to confirm.
Then we executed.
And once we were in the trade, the work didn't stop.
We managed risk.
We removed exposure.
We protected positions.
We allowed runners to continue.
We reassessed the narrative as price developed.
When Gold entered consolidation, we didn't abandon the original analysis simply because price bounced.
We recognised the possibility of AMD accumulation, manipulation and distribution.
When Gold approached the lows, we compared it with DXY.
When DXY approached its higher timeframe supply, we used that information as additional context.
When price created new liquidity, we mapped it.
When liquidity was taken, we reassessed.
When structure changed, we responded.
And when confirmation arrived, we acted.
That is the difference between having a trade idea and having a trading framework.
THE COMPLETE PROCESS
This week's trading can be reduced to one simple sequence:
1. HIGHER TIMEFRAME
Find the larger narrative.
Where is price?
What structure are we in?
Where is the untouched liquidity?
What is the likely destination?
2. LIQUIDITY
Identify what has already been taken.
Then identify what remains.
Look for:
Equal highs.
Equal lows.
Internal liquidity.
External liquidity.
Engineered liquidity.
Resting liquidity.
3. STRUCTURE
Determine whether the market is actually changing structure or simply producing a pullback.
A small reversal does not automatically equal a market shift.
Context matters.
4. INDUCEMENT
Ask who is being attracted into the market.
Who is buying?
Who is selling?
Where are their stops likely to be?
Where is liquidity being created?
5. AOI
Once the narrative is established, identify the area where the trade can actually be executed.
Supply.
Demand.
Order block.
FVG.
iFVG.
Liquidity block.
Golden zone.
Structure.
6. CONFIRMATION
We don't need to predict.
We wait for price to show us.
Lower timeframe confirmation.
Engulfing candles.
Structure breaks.
Reactions.
Liquidity sweeps.
Failed expansions.
7. EXECUTION
Defined entry.
Defined stop.
Defined invalidation.
Defined targets.
No emotional chasing.
8. MANAGEMENT
Once the trade is working:
Reduce exposure.
Protect capital.
Take partials where appropriate.
Move to risk free when justified.
Allow the remaining position to work toward the larger objective.
9. REASSESSMENT
The market doesn't owe us the original path.
If new information appears, we reassess.
If structure changes, we adapt.
If liquidity changes, the narrative changes.
10. ZOOM OUT
Never forget the timeframe above your trade.
The 1 minute chart can give you the entry.
The 15 minute can give you the setup.
The 1 hour can give you the structure.
The 4 hour can give you the destination.
The weekly can tell you what the entire move actually means.
THE FINAL LESSON
This week wasn't about one perfect entry.
It was about repeatedly applying the same framework to different conditions.
Higher timeframe vision.
Lower timeframe execution.
Liquidity before entry.
Structure before bias.
Confirmation before execution.
Defined risk before reward.
And most importantly:
We don't trade what we want to happen.
We trade what price shows us.
A level gives you a location.
Liquidity gives you a reason.
Structure gives you context.
Price action gives you confirmation.
Risk management keeps you in the game.
And the higher timeframe keeps you from getting lost in the noise.
That is the entire philosophy behind this week's trading.
Not prediction.
Not chasing.
Not guessing.
Planning.
Waiting.
Confirming.
Executing.
Managing.
And allowing the market to tell the story.
Because once you understand the story...
the candles stop being random.
The liquidity stops being random.
The pullbacks stop being random.
And the trade becomes the final execution of a narrative that was already visible before price made the move.

Declinazione di responsabilità
Le informazioni e le pubblicazioni non sono intese come, e non costituiscono, consulenza o raccomandazioni finanziarie, di investimento, di trading o di altro tipo fornite o approvate da TradingView. Per ulteriori informazioni, consultare i Termini di utilizzo.
Declinazione di responsabilità
Le informazioni e le pubblicazioni non sono intese come, e non costituiscono, consulenza o raccomandazioni finanziarie, di investimento, di trading o di altro tipo fornite o approvate da TradingView. Per ulteriori informazioni, consultare i Termini di utilizzo.