
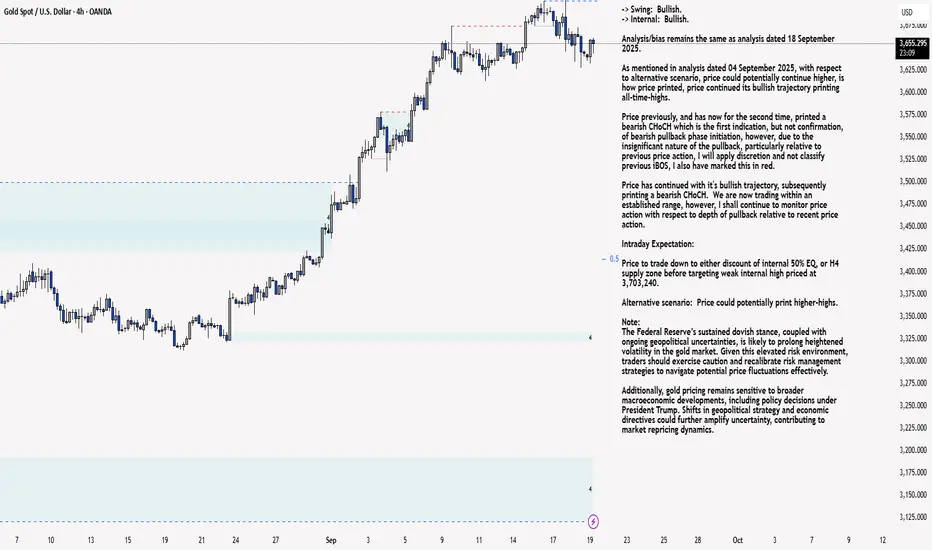
H4 Analysis:
-> Swing: Bullish.
-> Internal: Bullish.
Analysis/bias remains the same as analysis dated 18 September 2025.
As mentioned in analysis dated 04 September 2025, with respect to alternative scenario, price could potentially continue higher, is how price printed, price continued its bullish trajectory printing all-time-highs.
Price previously, and has now for the second time, printed a bearish CHoCH which is the first indication, but not confirmation, of bearish pullback phase initiation, however, due to the insignificant nature of the pullback, particularly relative to previous price action, I will apply discretion and not classify previous iBOS, I also have marked this in red.
Price has continued with it's bullish trajectory, subsequently printing a bearish CHoCH. We are now trading within an established range, however, I shall continue to monitor price action with respect to depth of pullback relative to recent price action.
Intraday Expectation:
Price to trade down to either discount of internal 50% EQ, or H4 supply zone before targeting weak internal high priced at 3,703,240.
Alternative scenario: Price could potentially print higher-highs.
Note:
The Federal Reserve’s sustained dovish stance, coupled with ongoing geopolitical uncertainties, is likely to prolong heightened volatility in the gold market. Given this elevated risk environment, traders should exercise caution and recalibrate risk management strategies to navigate potential price fluctuations effectively.
Additionally, gold pricing remains sensitive to broader macroeconomic developments, including policy decisions under President Trump. Shifts in geopolitical strategy and economic directives could further amplify uncertainty, contributing to market repricing dynamics.
H4 Chart:
M15 Analysis:
-> Swing: Bullish.
-> Internal: Bullish.
Analysis/bias remains the same as analysis dated 18 September 2025.
Price has continued with its bullish trajectory, printing all-time-highs.
Previous price action printed a bearish CHoCH, subsequently printing higher, however, due to the insignificant depth of the pullback, relative to recent price action, I shall again apply discretion and not classify this an an internal high. This marked this in red.
Price has since continued bullish, printing a bearish CHoCH. We are now trading within an established internal range.
Intraday Expectation:
Price has reacted from an M15 demand zone, within discount of 50% EQ. Price to target weak internal high priced at 3,703. 240
Alternative scenario: All HTF's require a corrective move, price has since failed to target and close above weak internal high therefore, and in order to confirm HTF bearish pullback phase, price could target strong internal low, priced at 3,612.240.
Note:
Gold remains highly volatile amid the Federal Reserve's continued dovish stance, persistent and escalating geopolitical uncertainties. Traders should implement robust risk management strategies and remain vigilant, as price swings may become more pronounced in this elevated volatility environment.
Additionally, President Trump’s recent tariff announcements are expected to further amplify market turbulence, potentially triggering sharp price fluctuations and whipsaws.
M15 Chart:
-> Swing: Bullish.
-> Internal: Bullish.
Analysis/bias remains the same as analysis dated 18 September 2025.
As mentioned in analysis dated 04 September 2025, with respect to alternative scenario, price could potentially continue higher, is how price printed, price continued its bullish trajectory printing all-time-highs.
Price previously, and has now for the second time, printed a bearish CHoCH which is the first indication, but not confirmation, of bearish pullback phase initiation, however, due to the insignificant nature of the pullback, particularly relative to previous price action, I will apply discretion and not classify previous iBOS, I also have marked this in red.
Price has continued with it's bullish trajectory, subsequently printing a bearish CHoCH. We are now trading within an established range, however, I shall continue to monitor price action with respect to depth of pullback relative to recent price action.
Intraday Expectation:
Price to trade down to either discount of internal 50% EQ, or H4 supply zone before targeting weak internal high priced at 3,703,240.
Alternative scenario: Price could potentially print higher-highs.
Note:
The Federal Reserve’s sustained dovish stance, coupled with ongoing geopolitical uncertainties, is likely to prolong heightened volatility in the gold market. Given this elevated risk environment, traders should exercise caution and recalibrate risk management strategies to navigate potential price fluctuations effectively.
Additionally, gold pricing remains sensitive to broader macroeconomic developments, including policy decisions under President Trump. Shifts in geopolitical strategy and economic directives could further amplify uncertainty, contributing to market repricing dynamics.
H4 Chart:
M15 Analysis:
-> Swing: Bullish.
-> Internal: Bullish.
Analysis/bias remains the same as analysis dated 18 September 2025.
Price has continued with its bullish trajectory, printing all-time-highs.
Previous price action printed a bearish CHoCH, subsequently printing higher, however, due to the insignificant depth of the pullback, relative to recent price action, I shall again apply discretion and not classify this an an internal high. This marked this in red.
Price has since continued bullish, printing a bearish CHoCH. We are now trading within an established internal range.
Intraday Expectation:
Price has reacted from an M15 demand zone, within discount of 50% EQ. Price to target weak internal high priced at 3,703. 240
Alternative scenario: All HTF's require a corrective move, price has since failed to target and close above weak internal high therefore, and in order to confirm HTF bearish pullback phase, price could target strong internal low, priced at 3,612.240.
Note:
Gold remains highly volatile amid the Federal Reserve's continued dovish stance, persistent and escalating geopolitical uncertainties. Traders should implement robust risk management strategies and remain vigilant, as price swings may become more pronounced in this elevated volatility environment.
Additionally, President Trump’s recent tariff announcements are expected to further amplify market turbulence, potentially triggering sharp price fluctuations and whipsaws.
M15 Chart:

Declinazione di responsabilità
Le informazioni e le pubblicazioni non sono intese come, e non costituiscono, consulenza o raccomandazioni finanziarie, di investimento, di trading o di altro tipo fornite o approvate da TradingView. Per ulteriori informazioni, consultare i Termini di utilizzo.
Declinazione di responsabilità
Le informazioni e le pubblicazioni non sono intese come, e non costituiscono, consulenza o raccomandazioni finanziarie, di investimento, di trading o di altro tipo fornite o approvate da TradingView. Per ulteriori informazioni, consultare i Termini di utilizzo.