
1. Market Structure Overview
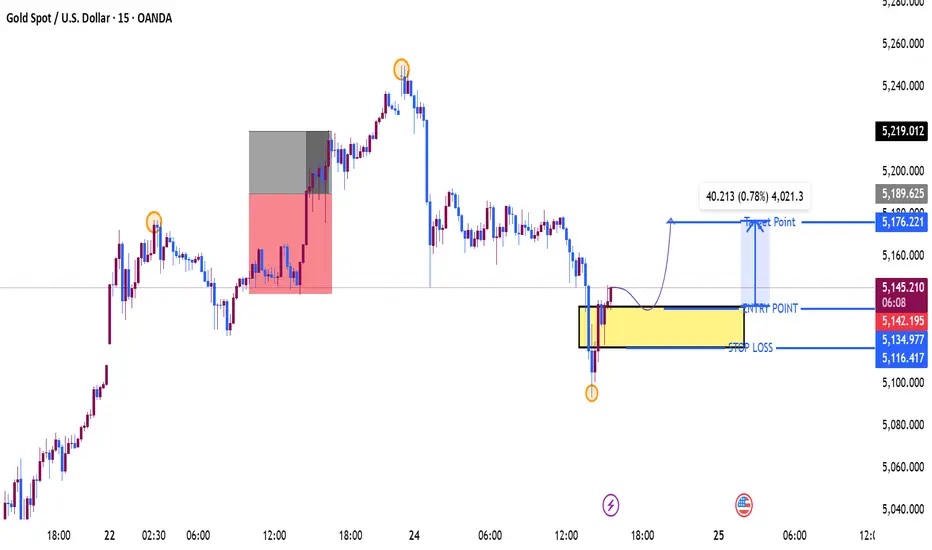
Bias: Short-term bearish → Possible bullish retracement setup
We had a strong push up (previous high marked).
Then a sharp impulsive selloff (strong displacement candle).
Price created a new lower low (circled at the bottom).
Now price is consolidating inside a demand / reaction zone (yellow box).
That shift suggests:
Intraday structure = bearish
Current move = retracement attempt
📉 2. The Sell-Side Liquidity Grab
The long lower wick (circled bottom) shows:
Liquidity taken below previous low
Stop hunts triggered
Strong rejection
This often leads to:
Short-term relief bounce before continuation
OR
Deeper retracement into supply
🟨 3. Current Zone (Yellow Box)
This looks like:
A mitigation / demand reaction area
Prior consolidation before breakdown
High-volume reaction zone
You marked:
Entry ≈ 5138
Stop ≈ 5116
Target ≈ 5176
Risk-to-reward is solid (~1:2+).
🎯 4. Target Logic (5176 Area)
Why 5176 makes sense:
Previous structure support → now resistance
Minor supply zone
Likely liquidity resting above consolidation highs
0.78% move projection
That’s a logical retracement target before continuation down.
⚠️ What Would Invalidate the Long?
Clean break and close below 5116
Strong bearish continuation candle
Failure to hold the yellow demand zone
If that happens:
→ Expect continuation toward 5090–5070 area.
🧠 Smart Money Perspective
This move looks like:
Distribution at highs
Displacement down
Liquidity sweep
Retracement to rebalance inefficiency
Then possible continuation
So this trade is likely:
Counter-trend scalp inside a bearish intraday structure.
📊 Probability Breakdown
5170–5180 reaction zone: HIGH probability rejection area
Continuation to new lows after retrace: Moderate probability
Full bullish reversal: Low probability (unless structure breaks above 5200)
💡 My Opinion
Your setup is:
✔ Structurally logical
✔ Good R:R
✔ Proper liquidity reasoning
But treat it as:
Intraday retracement trade — not trend reversal.
Bias: Short-term bearish → Possible bullish retracement setup
We had a strong push up (previous high marked).
Then a sharp impulsive selloff (strong displacement candle).
Price created a new lower low (circled at the bottom).
Now price is consolidating inside a demand / reaction zone (yellow box).
That shift suggests:
Intraday structure = bearish
Current move = retracement attempt
📉 2. The Sell-Side Liquidity Grab
The long lower wick (circled bottom) shows:
Liquidity taken below previous low
Stop hunts triggered
Strong rejection
This often leads to:
Short-term relief bounce before continuation
OR
Deeper retracement into supply
🟨 3. Current Zone (Yellow Box)
This looks like:
A mitigation / demand reaction area
Prior consolidation before breakdown
High-volume reaction zone
You marked:
Entry ≈ 5138
Stop ≈ 5116
Target ≈ 5176
Risk-to-reward is solid (~1:2+).
🎯 4. Target Logic (5176 Area)
Why 5176 makes sense:
Previous structure support → now resistance
Minor supply zone
Likely liquidity resting above consolidation highs
0.78% move projection
That’s a logical retracement target before continuation down.
⚠️ What Would Invalidate the Long?
Clean break and close below 5116
Strong bearish continuation candle
Failure to hold the yellow demand zone
If that happens:
→ Expect continuation toward 5090–5070 area.
🧠 Smart Money Perspective
This move looks like:
Distribution at highs
Displacement down
Liquidity sweep
Retracement to rebalance inefficiency
Then possible continuation
So this trade is likely:
Counter-trend scalp inside a bearish intraday structure.
📊 Probability Breakdown
5170–5180 reaction zone: HIGH probability rejection area
Continuation to new lows after retrace: Moderate probability
Full bullish reversal: Low probability (unless structure breaks above 5200)
💡 My Opinion
Your setup is:
✔ Structurally logical
✔ Good R:R
✔ Proper liquidity reasoning
But treat it as:
Intraday retracement trade — not trend reversal.
Trade chiuso: obiettivo raggiunto
Nota
Nota

join my telegram channel t.me/goldsignalicthttps://t.me/goldsignalicthttps://t.me/goldsignalict
Declinazione di responsabilità
Le informazioni e le pubblicazioni non sono intese come, e non costituiscono, consulenza o raccomandazioni finanziarie, di investimento, di trading o di altro tipo fornite o approvate da TradingView. Per ulteriori informazioni, consultare i Termini di utilizzo.
join my telegram channel t.me/goldsignalicthttps://t.me/goldsignalicthttps://t.me/goldsignalict
Declinazione di responsabilità
Le informazioni e le pubblicazioni non sono intese come, e non costituiscono, consulenza o raccomandazioni finanziarie, di investimento, di trading o di altro tipo fornite o approvate da TradingView. Per ulteriori informazioni, consultare i Termini di utilizzo.