
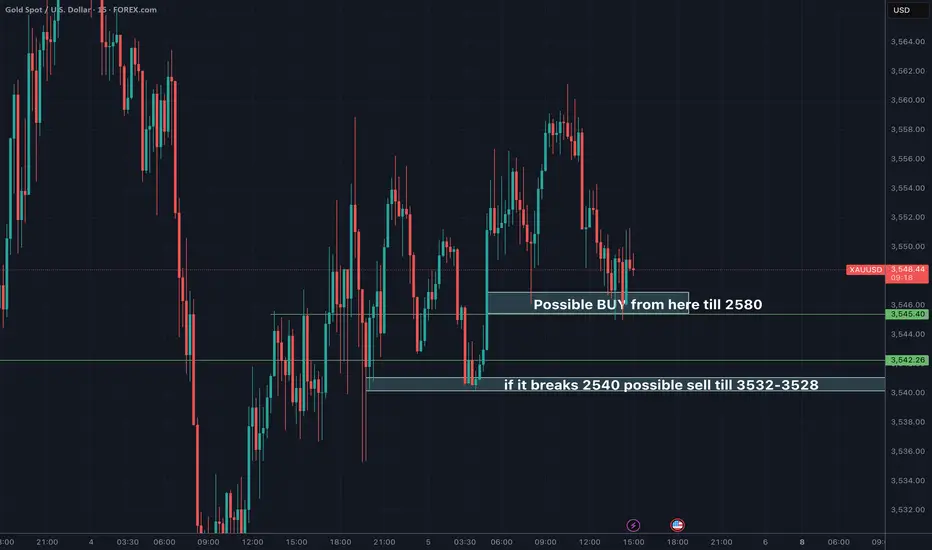
🔍 1. Technical Analysis (5-Minute Chart Review)
Price Structure
Price is currently at $3,549.71, having bounced twice off the $3,545.40 support and lower $3,542.26 support.
We're seeing short-term bullish rejection wicks near those support levels, suggesting buying interest.
Trend
On this intraday (5-min) chart: The market made a lower high and lower low, indicating a short-term downtrend, but this is being tested.
There's a potential reversal pattern forming (double bottom or inverse head-and-shoulders near $3,542 area).
Key Levels
Support:
$3,545.40 → Recent double rejection, acting as short-term support
$3,542.26 → Stronger horizontal support, tested multiple times
Resistance:
$3,551.30–$3,552.00 → Immediate resistance (previous lower high)
$3,557.00–$3,560.00 → Major intraday resistance (top before breakdown)
Indicators (Implied)
You have the "Buffett-Ackman RSI Support/Resistance Strategy" on — not shown directly, but the levels drawn seem to support RSI-based oversold zones near support.
Short-term candles are shrinking in body with long wicks → sign of buyer absorption of selling pressure.
🌐 2. Fundamental Analysis (As of Sept 5, 2025)
Macro Backdrop
USD Strength: Likely remains strong due to higher interest rates by the Fed (continuing 2024 tightening).
Inflation: If inflation remains sticky, it supports USD but also Gold due to its inflation hedge.
Geo-Political Risks: Any tensions (Russia/Ukraine, China/Taiwan) can spike gold as a safe haven.
Bond Yields: Rising yields pressure Gold due to opportunity cost of holding it. If yields cool, gold rallies.
Upcoming Events to Watch
US NFP (Jobs Data): If weak, USD drops and Gold may pump.
Fed Commentary: If dovish, bullish for gold.
CPI or PCE Inflation Data: Any downside surprise could trigger upside in Gold.
✅ 3. Trade Plan (Pro Setup)
🟢 Trade Idea: Long (Buy) XAUUSD – Countertrend Intraday Reversal
Entry: $3,546.00 (Buy limit just above the strong support zone)
Stop Loss: $3,540.50 (Below key swing low and liquidity zone)
Take Profit 1: $3,552.00 (Intraday resistance)
Take Profit 2: $3,557.00 (Key structure resistance)
Risk/Reward: ~1:2.5 minimum
🛡️ Reasoning:
Bullish rejection wicks on support zone ($3,542–$3,545)
Possible RSI oversold condition
Double bottom / consolidation = base formation
Risk tightly defined below structure
Fed uncertainty and safe haven bids can cause sudden spikes
⚠️ Alternative Scenario – If It Breaks Down
If $3,542.00 breaks convincingly with volume, then:
Flip bias short
Sell Below: $3,540.00
Target: $3,532.00–$3,528.00
Stop: $3,546.00
Reason: Clear breakdown of structure with liquidity hunt done
Price Structure
Price is currently at $3,549.71, having bounced twice off the $3,545.40 support and lower $3,542.26 support.
We're seeing short-term bullish rejection wicks near those support levels, suggesting buying interest.
Trend
On this intraday (5-min) chart: The market made a lower high and lower low, indicating a short-term downtrend, but this is being tested.
There's a potential reversal pattern forming (double bottom or inverse head-and-shoulders near $3,542 area).
Key Levels
Support:
$3,545.40 → Recent double rejection, acting as short-term support
$3,542.26 → Stronger horizontal support, tested multiple times
Resistance:
$3,551.30–$3,552.00 → Immediate resistance (previous lower high)
$3,557.00–$3,560.00 → Major intraday resistance (top before breakdown)
Indicators (Implied)
You have the "Buffett-Ackman RSI Support/Resistance Strategy" on — not shown directly, but the levels drawn seem to support RSI-based oversold zones near support.
Short-term candles are shrinking in body with long wicks → sign of buyer absorption of selling pressure.
🌐 2. Fundamental Analysis (As of Sept 5, 2025)
Macro Backdrop
USD Strength: Likely remains strong due to higher interest rates by the Fed (continuing 2024 tightening).
Inflation: If inflation remains sticky, it supports USD but also Gold due to its inflation hedge.
Geo-Political Risks: Any tensions (Russia/Ukraine, China/Taiwan) can spike gold as a safe haven.
Bond Yields: Rising yields pressure Gold due to opportunity cost of holding it. If yields cool, gold rallies.
Upcoming Events to Watch
US NFP (Jobs Data): If weak, USD drops and Gold may pump.
Fed Commentary: If dovish, bullish for gold.
CPI or PCE Inflation Data: Any downside surprise could trigger upside in Gold.
✅ 3. Trade Plan (Pro Setup)
🟢 Trade Idea: Long (Buy) XAUUSD – Countertrend Intraday Reversal
Entry: $3,546.00 (Buy limit just above the strong support zone)
Stop Loss: $3,540.50 (Below key swing low and liquidity zone)
Take Profit 1: $3,552.00 (Intraday resistance)
Take Profit 2: $3,557.00 (Key structure resistance)
Risk/Reward: ~1:2.5 minimum
🛡️ Reasoning:
Bullish rejection wicks on support zone ($3,542–$3,545)
Possible RSI oversold condition
Double bottom / consolidation = base formation
Risk tightly defined below structure
Fed uncertainty and safe haven bids can cause sudden spikes
⚠️ Alternative Scenario – If It Breaks Down
If $3,542.00 breaks convincingly with volume, then:
Flip bias short
Sell Below: $3,540.00
Target: $3,532.00–$3,528.00
Stop: $3,546.00
Reason: Clear breakdown of structure with liquidity hunt done

Declinazione di responsabilità
Le informazioni e le pubblicazioni non sono intese come, e non costituiscono, consulenza o raccomandazioni finanziarie, di investimento, di trading o di altro tipo fornite o approvate da TradingView. Per ulteriori informazioni, consultare i Termini di utilizzo.
Declinazione di responsabilità
Le informazioni e le pubblicazioni non sono intese come, e non costituiscono, consulenza o raccomandazioni finanziarie, di investimento, di trading o di altro tipo fornite o approvate da TradingView. Per ulteriori informazioni, consultare i Termini di utilizzo.