
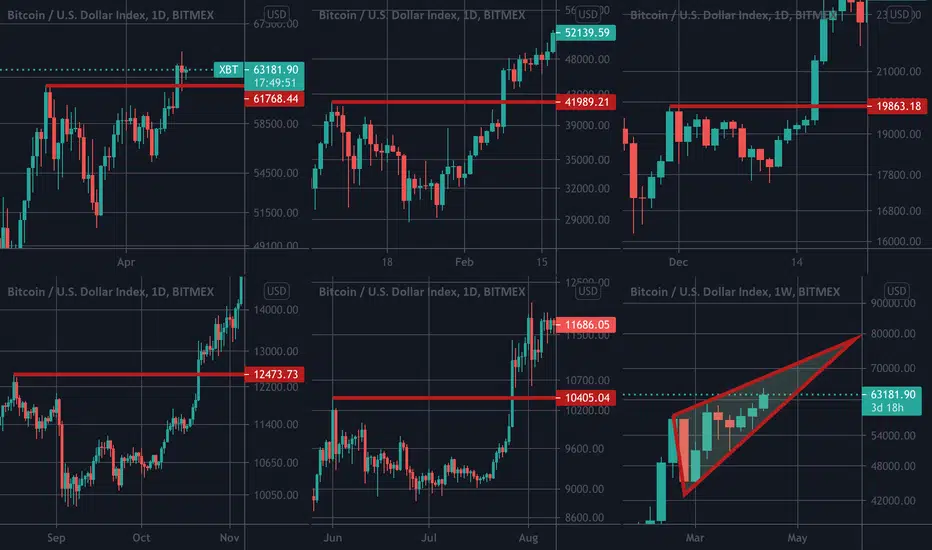
The first 5 charts are daily charts and show Bitcoin’s reactions to its resistance levels during this Bullish rally.
The last chart is weekly chart of Bitcoin.
There is a difference between the most recent and the previous four times that Bitcoin passed its resistance, can you identify what is that
Share your answer in the comments
The last chart is weekly chart of Bitcoin.
There is a difference between the most recent and the previous four times that Bitcoin passed its resistance, can you identify what is that
Share your answer in the comments

Use the following link to access trading ideas: patreon.com/SniperTraderStocks?utm_medium=unknown&utm_source=join_link&utm_campaign=creatorshare_creator&utm_content=copyLink
Declinazione di responsabilità
Le informazioni e le pubblicazioni non sono intese come, e non costituiscono, consulenza o raccomandazioni finanziarie, di investimento, di trading o di altro tipo fornite o approvate da TradingView. Per ulteriori informazioni, consultare i Termini di utilizzo.
Use the following link to access trading ideas: patreon.com/SniperTraderStocks?utm_medium=unknown&utm_source=join_link&utm_campaign=creatorshare_creator&utm_content=copyLink
Declinazione di responsabilità
Le informazioni e le pubblicazioni non sono intese come, e non costituiscono, consulenza o raccomandazioni finanziarie, di investimento, di trading o di altro tipo fornite o approvate da TradingView. Per ulteriori informazioni, consultare i Termini di utilizzo.