
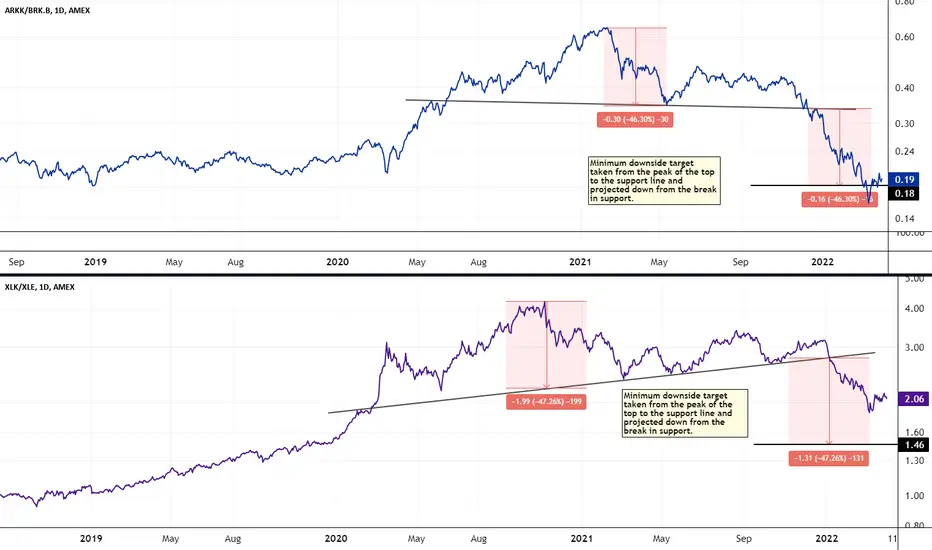
While these two charts aren't the same, they are very similar. The top chart is a ratio chart of ARKK vs Berk.B. The bottom chart is a ratio chart of Tech vs Energy. If the top chart is any indication of the overall trend, then there's plenty of upside in energy still. The downside of ARKK vs BERK.B overshot the minimum downside target. This is a logical area for a bounce. The Tech vs Energy ratio looks to have a ways to go still. These rounded tops are very dependable reversal patterns. Keep your eye open for broken support lines when watching these rounded tops play out.

Pubblicazioni correlate
Declinazione di responsabilità
Le informazioni e le pubblicazioni non sono intese come, e non costituiscono, consulenza o raccomandazioni finanziarie, di investimento, di trading o di altro tipo fornite o approvate da TradingView. Per ulteriori informazioni, consultare i Termini di utilizzo.
Pubblicazioni correlate
Declinazione di responsabilità
Le informazioni e le pubblicazioni non sono intese come, e non costituiscono, consulenza o raccomandazioni finanziarie, di investimento, di trading o di altro tipo fornite o approvate da TradingView. Per ulteriori informazioni, consultare i Termini di utilizzo.