
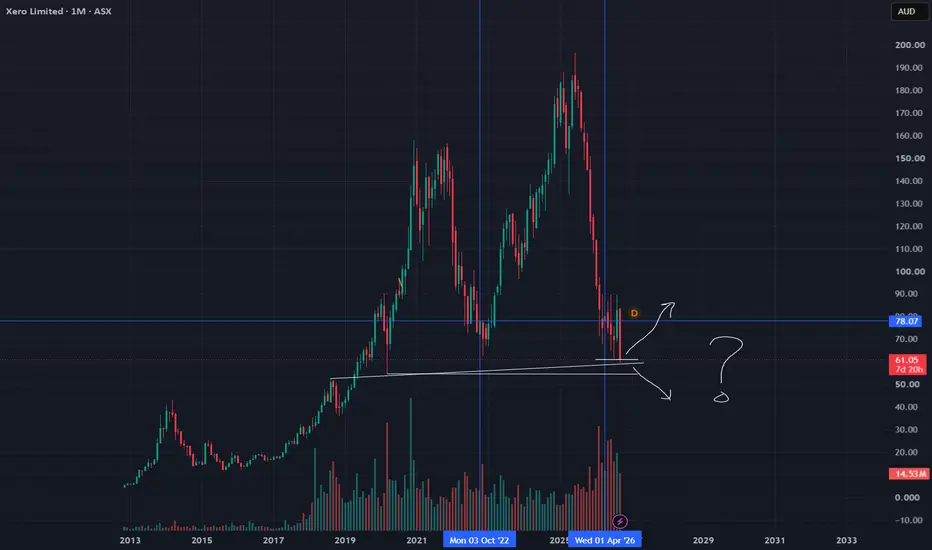
Xero (XRO), ASX200, has just printed one of the largest monthly candles in its history — a -26% collapse — pushing price back into a multi‑year structure that has defined the entire trend since 2022.
Here’s what I’m seeing on the monthly chart:
1. Major structural rejection
Price failed to hold above the long‑term range that started around Oct 2022, and the latest monthly candle shows a decisive rejection. The wick and body size indicate strong institutional selling rather than a normal retracement.
2. Return to the compression zone
The drop has pushed XRO back into the same zone it traded in for years — the area between the two vertical levels marked. This zone has historically acted as both accumulation and distribution depending on macro conditions.
3. Two clear scenarios ahead
Chart shows two arrows — one up, one down — which is exactly how this structure behaves:
Bullish scenario: Price stabilises inside the zone, forms a base, and attempts a multi‑month recovery. This would require slowing momentum on the monthly candles and a shift in volume behaviour.
Bearish scenario: Price fails to hold the zone and breaks down further, opening the door to a deeper long‑term correction. The size of the recent candle suggests this cannot be ignored.
4. Key levels to watch
The horizontal lines drew mark the critical support/resistance levels. These levels have repeatedly acted as decision points for XRO over the past decade.
5. What matters now
This is a genuine inflection point for the long‑term trend. The next 1–3 monthly candles will reveal whether this is a structural breakdown or a high‑volatility retest.
I’m publishing this idea to track how XRO behaves inside this zone and whether the next macro move is accumulation or continuation.
Here’s what I’m seeing on the monthly chart:
1. Major structural rejection
Price failed to hold above the long‑term range that started around Oct 2022, and the latest monthly candle shows a decisive rejection. The wick and body size indicate strong institutional selling rather than a normal retracement.
2. Return to the compression zone
The drop has pushed XRO back into the same zone it traded in for years — the area between the two vertical levels marked. This zone has historically acted as both accumulation and distribution depending on macro conditions.
3. Two clear scenarios ahead
Chart shows two arrows — one up, one down — which is exactly how this structure behaves:
Bullish scenario: Price stabilises inside the zone, forms a base, and attempts a multi‑month recovery. This would require slowing momentum on the monthly candles and a shift in volume behaviour.
Bearish scenario: Price fails to hold the zone and breaks down further, opening the door to a deeper long‑term correction. The size of the recent candle suggests this cannot be ignored.
4. Key levels to watch
The horizontal lines drew mark the critical support/resistance levels. These levels have repeatedly acted as decision points for XRO over the past decade.
5. What matters now
This is a genuine inflection point for the long‑term trend. The next 1–3 monthly candles will reveal whether this is a structural breakdown or a high‑volatility retest.
I’m publishing this idea to track how XRO behaves inside this zone and whether the next macro move is accumulation or continuation.

Declinazione di responsabilità
Le informazioni e le pubblicazioni non sono intese come, e non costituiscono, consulenza o raccomandazioni finanziarie, di investimento, di trading o di altro tipo fornite o approvate da TradingView. Per ulteriori informazioni, consultare i Termini di utilizzo.
Declinazione di responsabilità
Le informazioni e le pubblicazioni non sono intese come, e non costituiscono, consulenza o raccomandazioni finanziarie, di investimento, di trading o di altro tipo fornite o approvate da TradingView. Per ulteriori informazioni, consultare i Termini di utilizzo.