
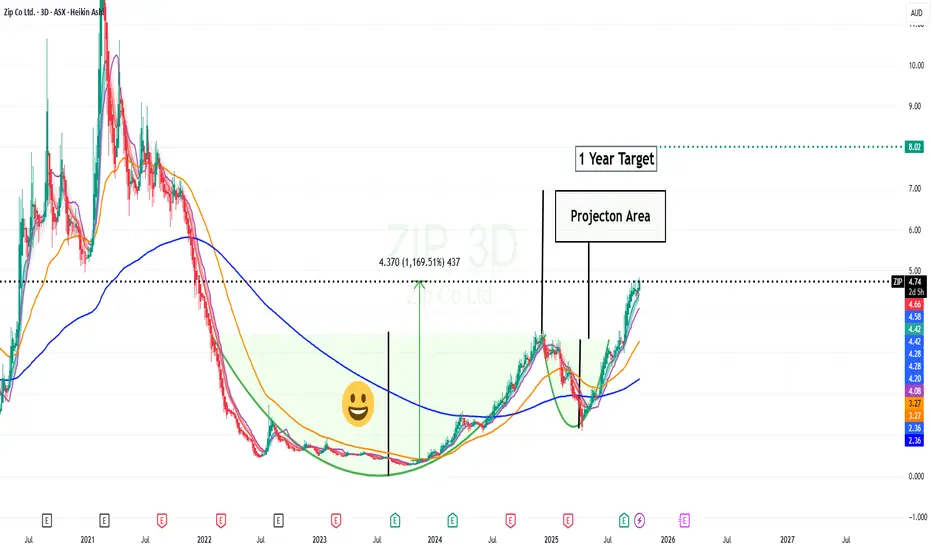
This chart shows why one needs to ride the wave and cycles that typical charts do print.
Zip is a classical one.
A Chart in a Chart with at least 2 time frames has been requested by me for a while now.
Lets see if the community supports this idea.
The simple idea is that one sees the current data with an Icon minimised on ones chart - such that with a click one can easily switch between both views so that we see current and the Long term Trends. The Long Term could also be the overview that Trading View gives one.
Should you appreciate my comments and chart studies - please smash that like button. It's just a click away.
Regards Graham
Zip is a classical one.
A Chart in a Chart with at least 2 time frames has been requested by me for a while now.
Lets see if the community supports this idea.
The simple idea is that one sees the current data with an Icon minimised on ones chart - such that with a click one can easily switch between both views so that we see current and the Long term Trends. The Long Term could also be the overview that Trading View gives one.
Should you appreciate my comments and chart studies - please smash that like button. It's just a click away.
Regards Graham
Trade attivo
Smiley face charts show a general uptrend and I add Capital.A frown face Chart is where I reduce ones Capital even in a Loss Scenario.

Declinazione di responsabilità
Le informazioni e le pubblicazioni non sono intese come, e non costituiscono, consulenza o raccomandazioni finanziarie, di investimento, di trading o di altro tipo fornite o approvate da TradingView. Per ulteriori informazioni, consultare i Termini di utilizzo.
Declinazione di responsabilità
Le informazioni e le pubblicazioni non sono intese come, e non costituiscono, consulenza o raccomandazioni finanziarie, di investimento, di trading o di altro tipo fornite o approvate da TradingView. Per ulteriori informazioni, consultare i Termini di utilizzo.