
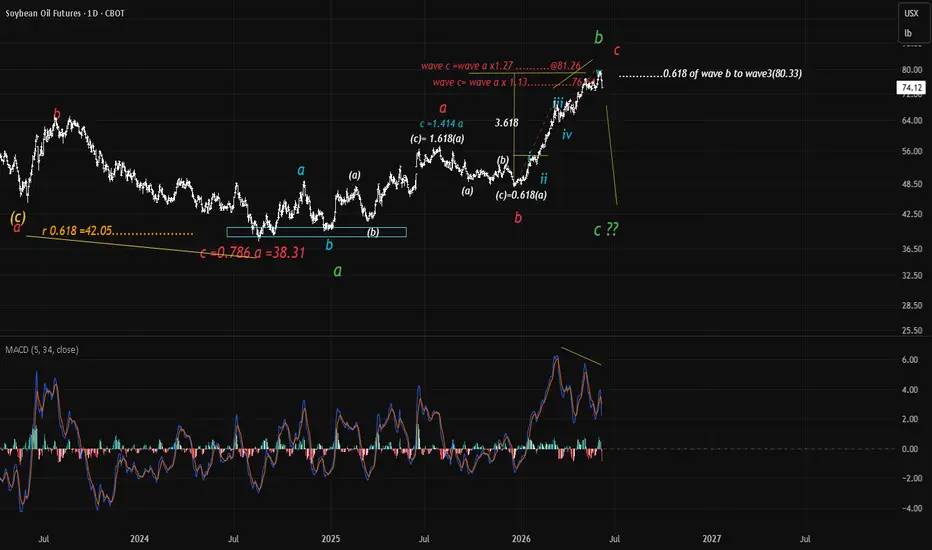
Since August 2024 market moved 111.6% over 448 trading days culminated in wave b of a larger degree to be followed by a move down for wave c.
Compelling indications of a high probable turn is seen with pronounced divergence between price and MACD followed by wave c(red) into a zone where 1.13 and 1.27 of wave a displayed loss of momentum and a 5-wave structure to complete wave c.
The wave relationship between wave v(0.618) to wave iii also fell in the resistive zone.
a 3.618 ratio from the top of wave i(blue) to wave v further adds weight to the topping possibility.
Weekly closing displayed a reversal minus which generally indicates a high chance of a reversal over and above the low closing.
A confirmation of the downturn is needed. Let the market unfold itself .
Compelling indications of a high probable turn is seen with pronounced divergence between price and MACD followed by wave c(red) into a zone where 1.13 and 1.27 of wave a displayed loss of momentum and a 5-wave structure to complete wave c.
The wave relationship between wave v(0.618) to wave iii also fell in the resistive zone.
a 3.618 ratio from the top of wave i(blue) to wave v further adds weight to the topping possibility.
Weekly closing displayed a reversal minus which generally indicates a high chance of a reversal over and above the low closing.
A confirmation of the downturn is needed. Let the market unfold itself .

Declinazione di responsabilità
Le informazioni e le pubblicazioni non sono intese come, e non costituiscono, consulenza o raccomandazioni finanziarie, di investimento, di trading o di altro tipo fornite o approvate da TradingView. Per ulteriori informazioni, consultare i Termini di utilizzo.
Declinazione di responsabilità
Le informazioni e le pubblicazioni non sono intese come, e non costituiscono, consulenza o raccomandazioni finanziarie, di investimento, di trading o di altro tipo fornite o approvate da TradingView. Per ulteriori informazioni, consultare i Termini di utilizzo.