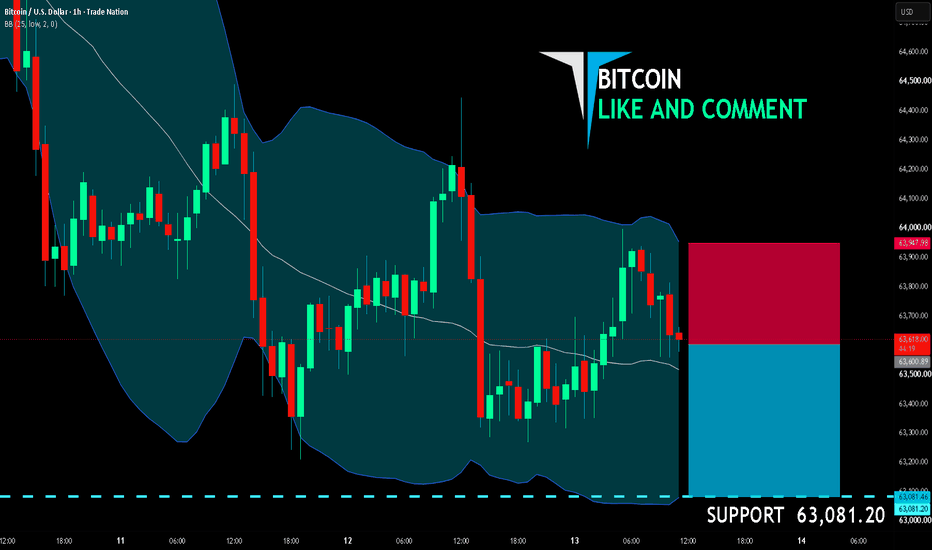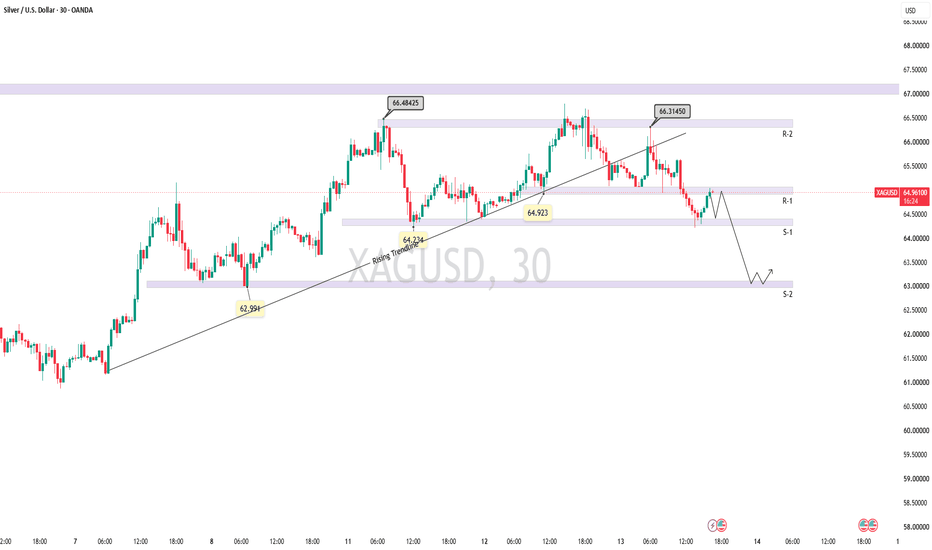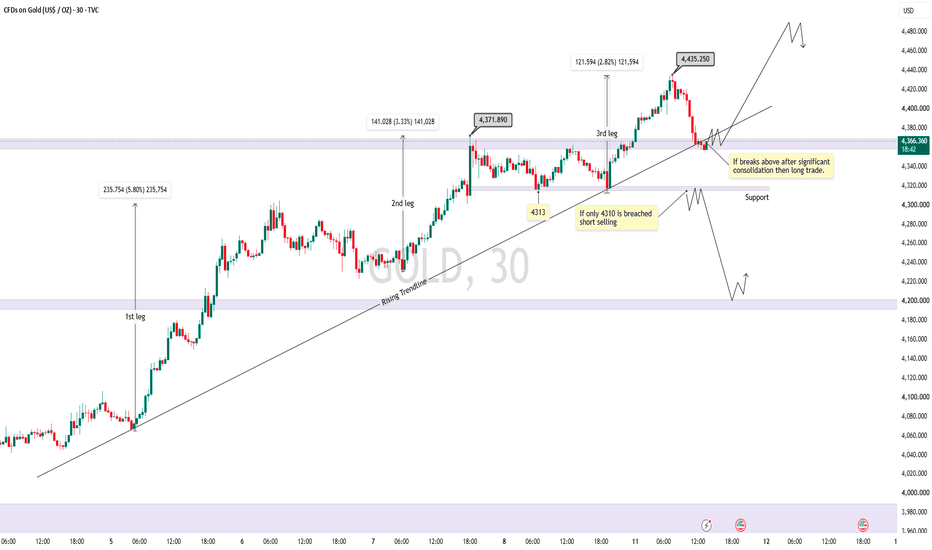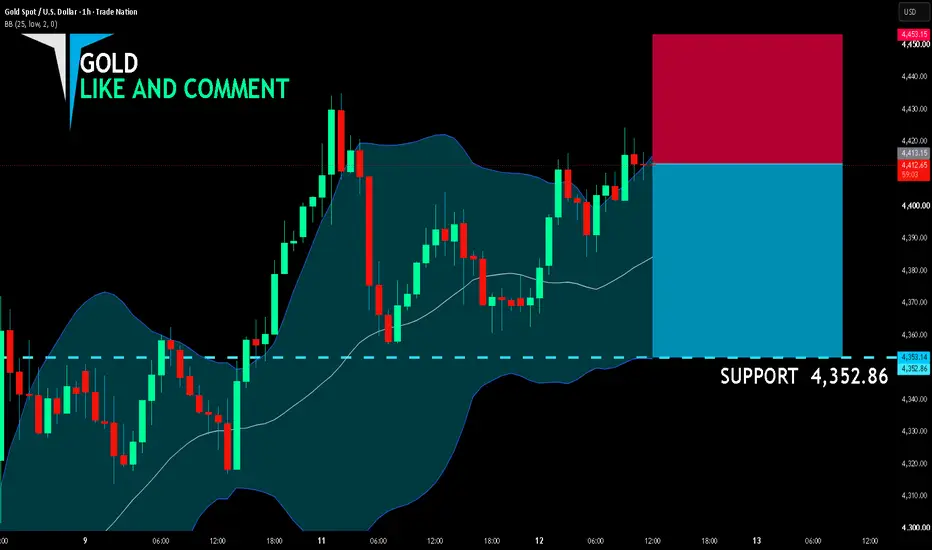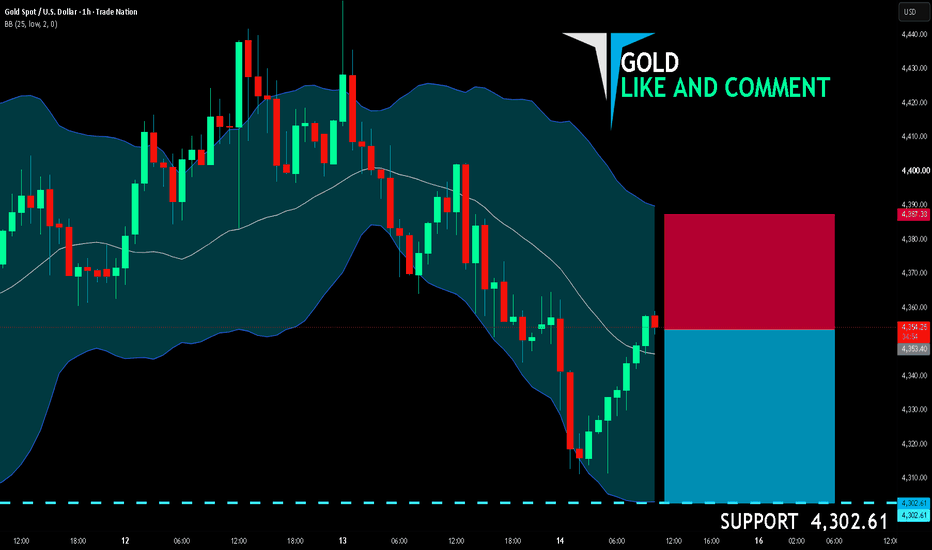
GOLD BEARISH BIAS RIGHT NOW| SHORT
GOLD SIGNAL
Trade Direction: short
Entry Level: 4,353.71
Target Level: 4,270.24
Stop Loss: 4,409.54
RISK PROFILE
Risk level: medium
Suggested risk: 1%
Timeframe: 1h
Disclosure: I am part of Trade Nation's Influencer program and receive a monthly fee for using their TradingView charts in my analysis.
✅LIKE AND COMMENT MY IDEAS✅
Bearish Patterns
GOLD — FOMC Week. This Is the Setup.Fourth consecutive weekly decline. Gold closed at $4,207, down 9% in a month.
The corrective bounce from $4,023 filled both FVG zones. Sellers returned.
Resistance zone: $4,165 – $4,234
Target: $3,999
Invalidation: daily close above $4,300
FOMC Wednesday — Warsh's first meeting as Chair. The dot plot is the event. Hawkish = below $4,000. Neutral = room to $4,300.
Trend is bearish. This week decides the next $200.
GBP/USD BEST PLACE TO SELL FROM|SHORT
Hello, Friends!
GBP/USD pair is in the uptrend because previous week’s candle is green, while the price is clearly rising on the 4H timeframe. And after the retest of the resistance line above I believe we will see a move down towards the target below at 1.337 because the pair overbought due to its proximity to the upper BB band and a bearish correction is likely.
Disclosure: I am part of Trade Nation's Influencer program and receive a monthly fee for using their TradingView charts in my analysis.
✅LIKE AND COMMENT MY IDEAS✅
EURNZD – Bears Need One More ConfirmationEURNZD is currently retesting a strong resistance zone marked in blue.
This area has repeatedly attracted sellers in the past, making it an important level to watch in the coming sessions.
However, despite the rejection from resistance, the bears have not fully taken control yet. 🐻
For the bearish scenario to gain momentum, a break below the last major low marked in red is needed.
Such a breakdown would confirm that sellers are regaining control and could open the door for a deeper correction.
📉 In that scenario, we will be expecting further downside toward the lower blue demand zone, which represents the next major support area on the chart.
Until then, the resistance zone remains the key area to monitor.
Will the bears finally break support and trigger the next leg lower? 🤔
⚠️ Disclaimer: This is not financial advice. Always do your own research and manage risk properly.
📚 Stick to your trading plan regarding entries, risk, and management.
Good luck! 🍀
All Strategies Are Good; If Managed Properly!
~Richard Nasr
USDCHF – Triple Resistance at 0.8000?USDCHF remains overall bearish , trading beneath the descending channel marked in red. 🔴
Currently, price is approaching a strong resistance zone formed by the intersection of three important factors:
📌 The falling trendline acting as a non-horizontal resistance.
📌 The blue supply zone.
📌 The psychological round number at 0.8000.
This confluence creates a high-probability rejection area where sellers may step back in and defend the broader bearish trend. 📊
As long as this intersection holds, we will be looking for shorts, anticipating another bearish leg lower from this resistance cluster.
The 0.8000 level will be the key area to watch in the coming sessions. ⚡
Will the bears defend this triple resistance zone once again? 🤔
⚠️ Disclaimer: This is not financial advice. Always do your own research and manage risk properly.
📚 Stick to your trading plan regarding entries, risk, and management.
Good luck! 🍀
All Strategies Are Good; If Managed Properly!
~Richard Nasr
EURUSD is Nearing a Decent Resistance!Hey Traders, in today's trading session we are monitoring EURUSD for a selling opportunity around 1.15900 zone, EURUSD is trading in a downtrend and currently is in a correction phase in which it is approaching the trend at 1.15900 support and resistance area.
Trade safe, Joe.
NZD/CAD BEARS ARE GAINING STRENGTH|SHORT
Hello, Friends!
We are going short on the NZD/CAD with the target of 0.810 level, because the pair is overbought and will soon hit the resistance line above. We deduced the overbought condition from the price being near to the upper BB band. However, we should use low risk here because the 1W TF is green and gives us a counter-signal.
Disclosure: I am part of Trade Nation's Influencer program and receive a monthly fee for using their TradingView charts in my analysis.
✅LIKE AND COMMENT MY IDEAS✅
AUD/CAD SELLERS WILL DOMINATE THE MARKET|SHORT
Hello, Friends!
We are now examining the AUD/CAD pair and we can see that the pair is going up locally while also being in a uptrend on the 1W TF. But there is also a powerful signal from the BB upper band being nearby, indicating that the pair is overbought so we can go short from the resistance line above and a target at 0.980 level.
Disclosure: I am part of Trade Nation's Influencer program and receive a monthly fee for using their TradingView charts in my analysis.
✅LIKE AND COMMENT MY IDEAS✅
Crude Oil Flashback Update: Bearish Scenario Gains TractionBack on May 13 and then on May 25, we discussed crude oil's ongoing sideways consolidation and highlighted the possibility that the market was nearing the end of a larger corrective pattern. Since then, price action has become increasingly interesting as crude oil starts to break beneath key support levels.
Crude oil is in a bit of a tricky position and has been trading sideways for quite some time now. We have been tracking an abcde triangle within wave B for the last two to three months, which may have actually completed back in May, unless the alternative scenario remains in play.
Now that the market is breaking below the lower triangle trendline, we should watch for additional weakness within a higher-degree wave C decline that can unfold as a lower-degree five-wave bearish cycle. In fact, crude oil may already be in the middle stages of wave (3), which is typically the strongest segment of an impulsive move.
The latest weakness accelerated after President Trump said that the United States was close to reaching an agreement with Iran, raising hopes for a diplomatic resolution and potentially increasing future oil supply. As such, traders should be aware of further bearish continuation, while keeping an eye on short-term intraday pullbacks that could offer temporary relief rallies.
However, there is still an alternative count to consider. If crude oil suddenly rallies back toward the 95 area, then the bearish triangle consolidation may still be ongoing, with wave E yet to unfold before the larger downtrend resumes.
For now, the break beneath triangle support gives the bearish outlook the upper hand, suggesting that wave C lower may already be underway.
NZD/JPY BEARISH BIAS RIGHT NOW| SHORT
Hello, Friends!
The BB upper band is nearby so NZD-JPY is in the overbought territory. Thus, despite the uptrend on the 1W timeframe I think that we will see a bearish reaction from the resistance line above and a move down towards the target at around 92.629.
Disclosure: I am part of Trade Nation's Influencer program and receive a monthly fee for using their TradingView charts in my analysis.
✅LIKE AND COMMENT MY IDEAS✅
ETH/USD BEST PLACE TO SELL FROM|SHORT
ETH/USD SIGNAL
Trade Direction: short
Entry Level: 1,670.23
Target Level: 1,632.13
Stop Loss: 1,695.58
RISK PROFILE
Risk level: medium
Suggested risk: 1%
Timeframe: 1h
Disclosure: I am part of Trade Nation's Influencer program and receive a monthly fee for using their TradingView charts in my analysis.
✅LIKE AND COMMENT MY IDEAS✅
GBP/NZD BEARS ARE STRONG HERE|SHORT
Hello, Friends!
Bearish trend on GBP/NZD, defined by the red colour of the last week candle combined with the fact the pair is overbought based on the BB upper band proximity, makes me expect a bearish rebound from the resistance line above and a retest of the local target below at 2.286.
Disclosure: I am part of Trade Nation's Influencer program and receive a monthly fee for using their TradingView charts in my analysis.
✅LIKE AND COMMENT MY IDEAS✅
GBP/CHF SHORT FROM RESISTANCE
GBP/CHF SIGNAL
Trade Direction: short
Entry Level: 1.067
Target Level: 1.065
Stop Loss: 1.068
RISK PROFILE
Risk level: medium
Suggested risk: 1%
Timeframe: 1h
Disclosure: I am part of Trade Nation's Influencer program and receive a monthly fee for using their TradingView charts in my analysis.
✅LIKE AND COMMENT MY IDEAS✅
CAD/CHF BEARS ARE STRONG HERE|SHORT
Hello, Friends!
We are targeting the 0.569 level area with our short trade on CAD/CHF which is based on the fact that the pair is overbought on the BB band scale and is also approaching a resistance line above thus going us a good entry option.
Disclosure: I am part of Trade Nation's Influencer program and receive a monthly fee for using their TradingView charts in my analysis.
✅LIKE AND COMMENT MY IDEAS✅
Complacency is at extreme levels. Expect a sharp selloff. The put-call ratio is a measure of sentiment in the market and it's signaling extreme complacency. This is a sign to be bearish. These extreme readings have typically led to sizable corrections so I expect the same this time as well. I'm assuming at least a 10-15% selloff, most likely to the march lows.
EURUSD Resistance at1.16000 as Hot CPI Boosts the US Dollar!Hey Traders,
In today's trading session, we are monitoring EURUSD for a potential selling opportunity around the 1.16000 zone. EURUSD is trading within a broader downtrend and is currently in a corrective phase, with price approaching the 1.16000 resistance area, a key support-turned-resistance level that could act as a barrier to further upside.
From a fundamental perspective, today's U.S. CPI data came in strong enough to reinforce the higher-for-longer interest rate narrative, supporting Treasury yields and strengthening the U.S. Dollar. As markets continue to scale back expectations for aggressive Fed rate cuts, the dollar remains well supported across the board.
This creates a challenging environment for EURUSD, particularly as the pair rallies into a major technical resistance zone. With the Fed maintaining a relatively hawkish stance compared to other major central banks, any rejection from the 1.16000 area could attract renewed selling interest.
As long as price remains below the 1.16000 resistance zone, the bearish structure remains intact, and we anticipate continuation toward lower support levels.
Trade safe,Joe.
SPY - A Swing Low Was Just SweptSPY Has Given Back Most of the April Rally in Two Weeks. A Swing Low Was Just Swept.
Whether that sweep holds or fails is this morning's question.
Structural Assessment
SOM is reading Impulse Cont. Bear on SPY 1H.
15 primary FVGs alive, 12 touched. The obligation pool
built during the April-May rally is being systematically
worked. 12 touched against 15 primary means 80 percent
of current obligations have been engaged. The market is
not ignoring structure on the way down.
ACE is GREEN with Q2 neutral. CQI 58.5. Last Ann was
Bull CQI 71.22, 156 bars ago. Direction neutral against
a bull announcement from 156 bars back. The conviction
that was present at the high has fully decayed.
IMP is scoring 1/5. NONE mode. WAIT.
SwLo Swept: YES. A swing low was taken out.
RCZ at 26th pct, ATR at 48th. Neither elevated.
Vol Elev at 2nd percentile -- volume has not confirmed
the sweep. A swing low sweep without volume is a
structural note, not a signal.
Anti-signal: clear. The sweep itself is not flagged
as a liquidity grab by the stack -- it cleared cleanly.
Tactical Cheat Sheet
Resistance: 732-733 -- nearest overhead level
Key resistance: 737.57-738.47 -- prior FVG cluster base
Hard resistance: 741-742 -- dense FVG overhead
Current price: 730.63
Support: 728.00 -- intraday structural level
Key support: 721.23 -- session Low, thesis line
Extended support: 703.07 -- daily obligation cluster
SwLo Swept context:
The swing low sweep with Vol Elev at 2nd percentile
is not a confirmed breakdown. It is a probe. Price
tested below the prior low without volume conviction.
Two outcomes follow from here:
Reclaim path (sweep as liquidity grab):
Price reclaims 732 at open with Vol Elev entering
IMP scores 1+ with PART mode loading
The sweep was a stop run, not a breakdown
Target: 737-742 FVG cluster fill
Continuation path (sweep as breakdown):
Price fails to reclaim 732 on first attempt
Vol Elev enters and drives price through 728
IMP loads EXT mode with ATR expanding
Target: 721.23 test
What the Stack Is Watching
The swing low sweep is the event. Volume is the
verdict. If volume does not enter at the open to
confirm direction, this is noise in a bear structure,
not a signal in either direction.
RCZ at 26th pct is the watch variable. If it starts
climbing toward 60th in the first hour, the
participation sub-system is activating. That is when
the sweep resolves into a tradeable setup.
---
Built with SYNTHESIS v3.3 | SOM / ACE / IMP / SYNTHESIS
Study, not financial advice.
NVDA - The Overhead Pool Is Still In Play.NVDA Has Been Grinding Through Structure All Week. The Overhead Pool Is Still In Play.
Price is not lost. It is being worked.
Structural Assessment
SOM is reading Impulse Cont. Bear on NVDA 1H.
16 primary FVGs alive, 21 touched. The touched count
exceeding the current pool size tells you something
specific: price has been actively engaging and resolving
prior obligations. This is not a market drifting lower.
It is a market working through structure methodically.
ACE is YELLOW with Q2 neutral. CQI 57.5. The last
announced bar was Bear CQI 45.64, 82 bars ago. Direction
is neutral against a recent bear announcement. No state
reading -- the intraday conviction has not committed.
IMP is scoring 0/5. NONE mode. WAIT.
RCZ at 16th percentile, ATR at 59th. Range is compressed
but ATR is mid-range. The coil is partial -- volatility
memory is present but the range trigger has not built yet.
Vol Elev at 4th percentile. Volume is absent.
The stack is in observation mode on NVDA this morning.
No signal. No anti-signal. No directional commitment.
Just price sitting beneath a significant FVG cluster
with no volume to resolve it yet.
Tactical Cheat Sheet
Resistance: 204.65 -- first FVG level above
Key resistance: 205.75-208.79 -- dense FVG cluster
Hard resistance: 209.34-210.45 -- upper cluster boundary
Current price: 202.19
Support: 199.89-200.50 -- structural floor cluster
Key support: 198.88 -- session Low, thesis line
Extended support: 191.23 -- prior structural low
Two paths this morning:
Recovery path:
Vol Elev enters above 30th pct at open
IMP loads PART mode with RCZ climbing off 16th
Price reclaims 204.65 and tests the FVG cluster
ACE Q2 resolves toward Q1 with directional weight
Target: 208-210 cluster on first leg
Continuation lower:
Price fails to reclaim 204 on first attempt
Vol Elev stays below 10th through the open hour
IMP loads EXT mode as ATR expands from 59th
Support at 199.89 becomes the test
Below 198.88 opens 191.23
The FVG cluster at 205-210 is the decision zone.
Whether price is rejected there or absorbs through it
defines the next 2 to 3 sessions.
What the Stack Is Watching
21 touched FVGs says the market has been doing work.
The overhead cluster at 205-210 is what that work has
been building toward. Volume has not shown up yet to
resolve the test.
Watch Vol Elev and RCZ in the first 30 minutes.
Those two moving together is the signal that the
observation phase is ending.
---
Built with SYNTHESIS v3.3 | SOM / ACE / IMP / SYNTHESIS
Study, not financial advice.
AUDUSD Bearish After Strong US Inflation Data!Hey Traders,
In today's trading session, we are monitoring AUDUSD for a potential selling opportunity around the 0.70500 zone. AUDUSD is trading in a broader downtrend and is currently in a corrective phase, with price approaching the 0.70500 resistance area, a key support-turned-resistance zone that could provide an attractive opportunity for bearish continuation.
From a fundamental perspective, today's U.S. CPI data came in hotter than expected, reinforcing the market's higher-for-longer interest rate expectations and providing fresh support for the U.S. Dollar. The stronger inflation reading has reduced expectations for near-term Fed easing, pushing Treasury yields higher and increasing demand for the greenback.
For AUDUSD, this creates a difficult backdrop. As a risk-sensitive currency, the Australian Dollar tends to struggle when the U.S. Dollar strengthens and yields move higher. With markets reassessing the outlook for Fed policy following the CPI release, the balance of risks continues to favor USD strength over AUD.
With price now correcting into the 0.70500 resistance zone within a broader bearish structure, rallies continue to look attractive for sellers.
As long as price remains below the 0.70500 resistance zone, the bearish trend remains intact, and we anticipate continuation toward lower support levels.
Trade safe, Joe.
GBP/USD SELLERS WILL DOMINATE THE MARKET|SHORT
GBP/USD SIGNAL
Trade Direction: short
Entry Level: 1.338
Target Level: 1.335
Stop Loss: 1.340
RISK PROFILE
Risk level: medium
Suggested risk: 1%
Timeframe: 1h
Disclosure: I am part of Trade Nation's Influencer program and receive a monthly fee for using their TradingView charts in my analysis.
✅LIKE AND COMMENT MY IDEAS✅
AUDJPY Breakout and Potential Retrace!Hey Traders, in today's trading session we are monitoring AUDJPY for a selling opportunity around 113.400 zone, AUDJPY was trading in an uptrend and successfully managed to break it out. Currently is in a correction phase in which it is approaching the retrace at 113.400 support and resistance area.
Trade safe, Joe.