EUR/AUD BEARS WILL DOMINATE THE MARKET|SHORT
Hello, Friends!
EUR/AUD is trending down which is evident from the red colour of the previous weekly candle. However, the price has locally surged into the overbought territory. Which can be told from its proximity to the BB upper band. Which presents a beautiful trend following opportunity for a short trade from the resistance line above towards the demand level of 1.638.
Disclosure: I am part of Trade Nation's Influencer program and receive a monthly fee for using their TradingView charts in my analysis.
✅LIKE AND COMMENT MY IDEAS✅
Bearish Patterns
EURUSD is Nearing a Decent Resistance Line!Hey Traders, in today's trading session we are monitoring EURUSD for a selling opportunity around 1.16300 zone, EURUSD is trading in a downtrend and currently is in a correction phase in which it is approaching the trend at 1.16300 support and resistance area.
Trade safe, Joe.
AUDUSD is Nearing a Strong Resistance Line! Hey Traders, in today's trading session we are monitoring AUDUSD for a selling opportunity around 0.71200 zone, AUDUSD is trading in a downtrend and currently is in a correction phase in which it is approaching the trend at 0.71200 support and resistance area.
Trade safe, Joe.
AUDUSD – A Confluence Zone Worth WatchingAUDUSD remains overall bearish, trading within a falling channel marked in blue.
After the recent rebound, price is now approaching a strong intersection formed by:
The upper blue trendline acting as a non-horizontal resistance
The supply zone marked in red
This confluence creates a high-probability area where sellers may step back into the market. 📉
As long as this intersection holds, we will be looking for trend-following shorts.
A bearish rejection from this zone could trigger the next leg lower and keep the broader downtrend intact.
For now, all eyes remain on the resistance confluence ahead.
Will the bears defend it once again? 🐻
⚠️ Disclaimer: This is not financial advice. Always do your own research and manage risk properly.
📚 Stick to your trading plan regarding entries, risk, and management.
Good luck! 🍀
All Strategies Are Good; If Managed Properly!
~Richard Nasr
EUR/USD BEARS ARE STRONG HERE|SHORT
EUR/USD SIGNAL
Trade Direction: short
Entry Level: 1.160
Target Level: 1.158
Stop Loss: 1.162
RISK PROFILE
Risk level: medium
Suggested risk: 1%
Timeframe: 1h
Disclosure: I am part of Trade Nation's Influencer program and receive a monthly fee for using their TradingView charts in my analysis.
✅LIKE AND COMMENT MY IDEAS✅
EUR/CHF BEARS ARE GAINING STRENGTH|SHORT
EUR/CHF SIGNAL
Trade Direction: short
Entry Level: 0.921
Target Level: 0.919
Stop Loss: 0.922
RISK PROFILE
Risk level: medium
Suggested risk: 1%
Timeframe: 1h
Disclosure: I am part of Trade Nation's Influencer program and receive a monthly fee for using their TradingView charts in my analysis.
✅LIKE AND COMMENT MY IDEAS✅
NZD/CHF BEARS WILL DOMINATE THE MARKET|SHORT
Hello, Friends!
NZD/CHF pair is trading in a local uptrend which we know by looking at the previous 1W candle which is green. On the 9H timeframe the pair is going up too. The pair is overbought because the price is close to the upper band of the BB indicator. So we are looking to sell the pair with the upper BB line acting as resistance. The next target is 0.463 area.
Disclosure: I am part of Trade Nation's Influencer program and receive a monthly fee for using their TradingView charts in my analysis.
✅LIKE AND COMMENT MY IDEAS✅
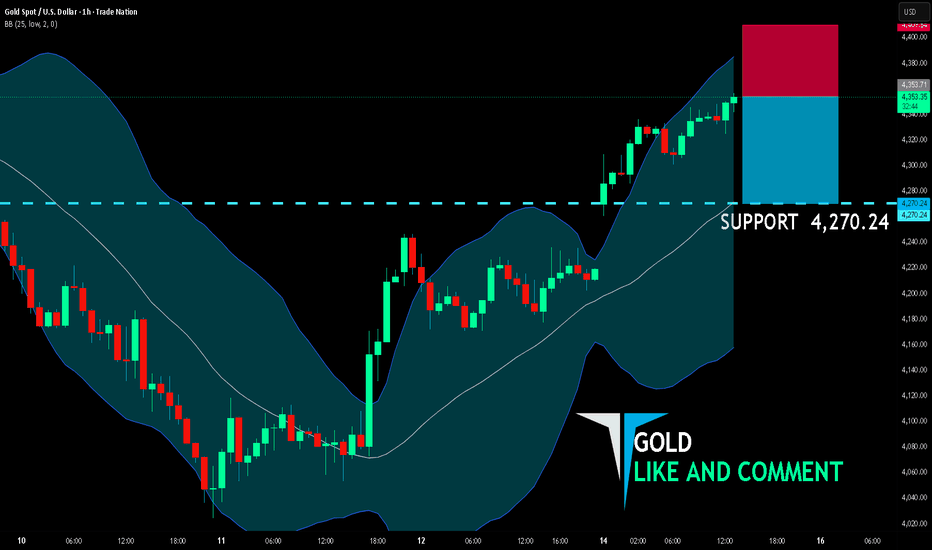
GOLD BEARISH BIAS RIGHT NOW| SHORT
GOLD SIGNAL
Trade Direction: short
Entry Level: 4,353.71
Target Level: 4,270.24
Stop Loss: 4,409.54
RISK PROFILE
Risk level: medium
Suggested risk: 1%
Timeframe: 1h
Disclosure: I am part of Trade Nation's Influencer program and receive a monthly fee for using their TradingView charts in my analysis.
✅LIKE AND COMMENT MY IDEAS✅
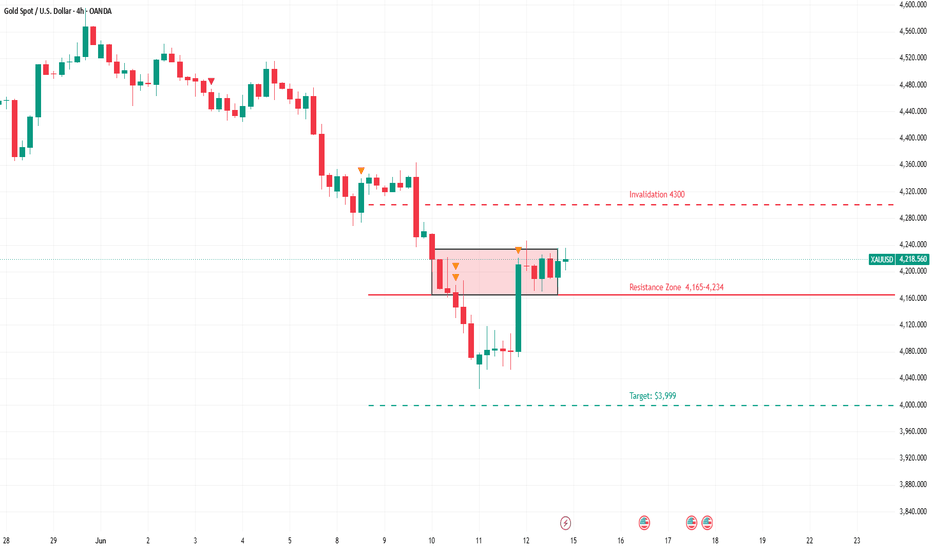
GOLD — FOMC Week. This Is the Setup.Fourth consecutive weekly decline. Gold closed at $4,207, down 9% in a month.
The corrective bounce from $4,023 filled both FVG zones. Sellers returned.
Resistance zone: $4,165 – $4,234
Target: $3,999
Invalidation: daily close above $4,300
FOMC Wednesday — Warsh's first meeting as Chair. The dot plot is the event. Hawkish = below $4,000. Neutral = room to $4,300.
Trend is bearish. This week decides the next $200.
GBP/USD BEST PLACE TO SELL FROM|SHORT
Hello, Friends!
GBP/USD pair is in the uptrend because previous week’s candle is green, while the price is clearly rising on the 4H timeframe. And after the retest of the resistance line above I believe we will see a move down towards the target below at 1.337 because the pair overbought due to its proximity to the upper BB band and a bearish correction is likely.
Disclosure: I am part of Trade Nation's Influencer program and receive a monthly fee for using their TradingView charts in my analysis.
✅LIKE AND COMMENT MY IDEAS✅
EURNZD – Bears Need One More ConfirmationEURNZD is currently retesting a strong resistance zone marked in blue.
This area has repeatedly attracted sellers in the past, making it an important level to watch in the coming sessions.
However, despite the rejection from resistance, the bears have not fully taken control yet. 🐻
For the bearish scenario to gain momentum, a break below the last major low marked in red is needed.
Such a breakdown would confirm that sellers are regaining control and could open the door for a deeper correction.
📉 In that scenario, we will be expecting further downside toward the lower blue demand zone, which represents the next major support area on the chart.
Until then, the resistance zone remains the key area to monitor.
Will the bears finally break support and trigger the next leg lower? 🤔
⚠️ Disclaimer: This is not financial advice. Always do your own research and manage risk properly.
📚 Stick to your trading plan regarding entries, risk, and management.
Good luck! 🍀
All Strategies Are Good; If Managed Properly!
~Richard Nasr
USDCHF – Triple Resistance at 0.8000?USDCHF remains overall bearish , trading beneath the descending channel marked in red. 🔴
Currently, price is approaching a strong resistance zone formed by the intersection of three important factors:
📌 The falling trendline acting as a non-horizontal resistance.
📌 The blue supply zone.
📌 The psychological round number at 0.8000.
This confluence creates a high-probability rejection area where sellers may step back in and defend the broader bearish trend. 📊
As long as this intersection holds, we will be looking for shorts, anticipating another bearish leg lower from this resistance cluster.
The 0.8000 level will be the key area to watch in the coming sessions. ⚡
Will the bears defend this triple resistance zone once again? 🤔
⚠️ Disclaimer: This is not financial advice. Always do your own research and manage risk properly.
📚 Stick to your trading plan regarding entries, risk, and management.
Good luck! 🍀
All Strategies Are Good; If Managed Properly!
~Richard Nasr
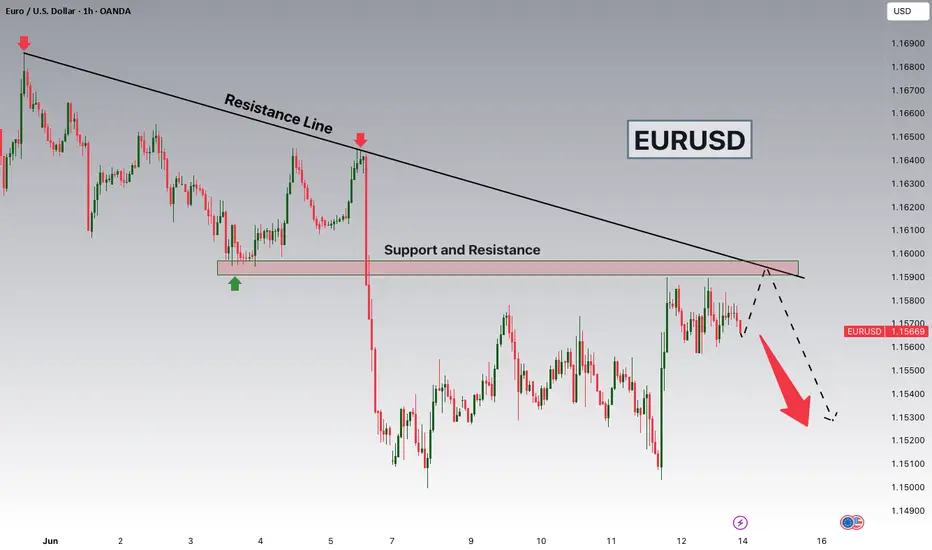
EURUSD is Nearing a Decent Resistance!Hey Traders, in today's trading session we are monitoring EURUSD for a selling opportunity around 1.15900 zone, EURUSD is trading in a downtrend and currently is in a correction phase in which it is approaching the trend at 1.15900 support and resistance area.
Trade safe, Joe.
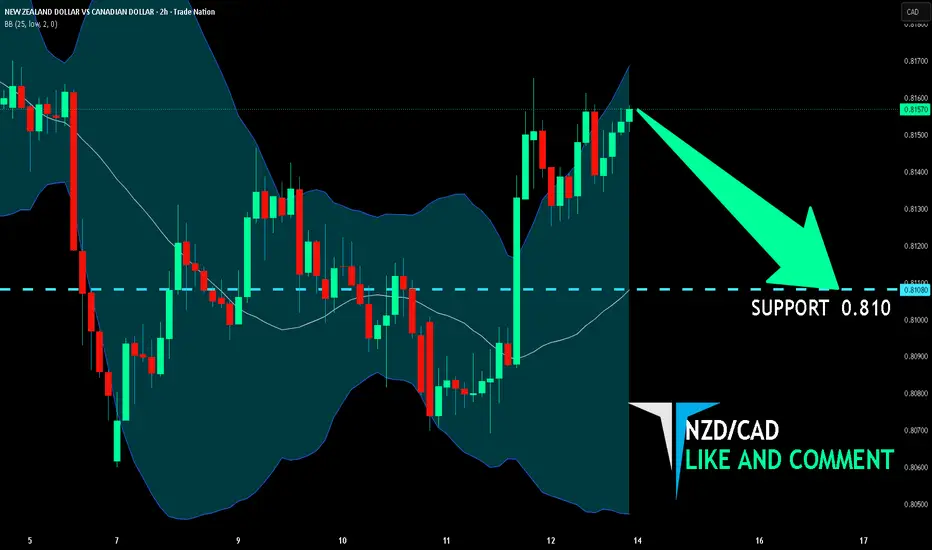
NZD/CAD BEARS ARE GAINING STRENGTH|SHORT
Hello, Friends!
We are going short on the NZD/CAD with the target of 0.810 level, because the pair is overbought and will soon hit the resistance line above. We deduced the overbought condition from the price being near to the upper BB band. However, we should use low risk here because the 1W TF is green and gives us a counter-signal.
Disclosure: I am part of Trade Nation's Influencer program and receive a monthly fee for using their TradingView charts in my analysis.
✅LIKE AND COMMENT MY IDEAS✅
AUD/CAD SELLERS WILL DOMINATE THE MARKET|SHORT
Hello, Friends!
We are now examining the AUD/CAD pair and we can see that the pair is going up locally while also being in a uptrend on the 1W TF. But there is also a powerful signal from the BB upper band being nearby, indicating that the pair is overbought so we can go short from the resistance line above and a target at 0.980 level.
Disclosure: I am part of Trade Nation's Influencer program and receive a monthly fee for using their TradingView charts in my analysis.
✅LIKE AND COMMENT MY IDEAS✅
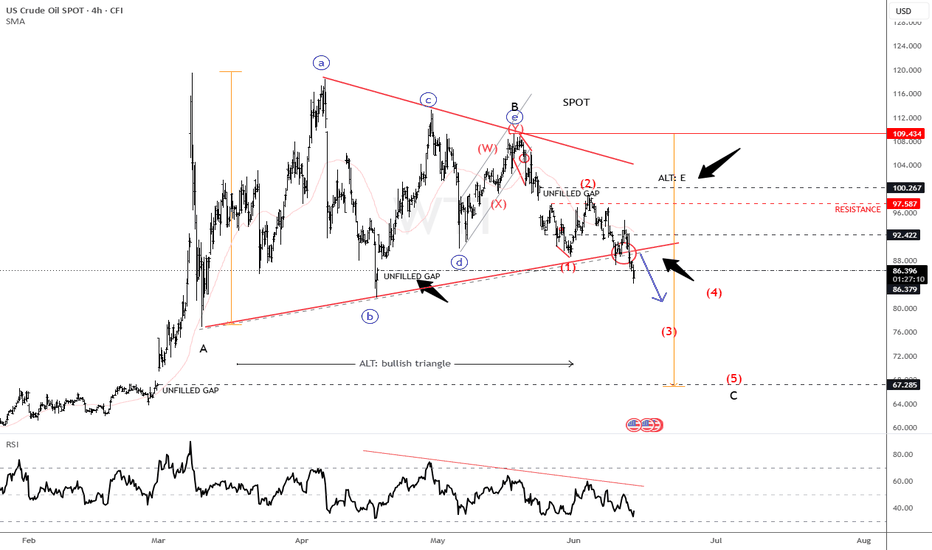
Crude Oil Flashback Update: Bearish Scenario Gains TractionBack on May 13 and then on May 25, we discussed crude oil's ongoing sideways consolidation and highlighted the possibility that the market was nearing the end of a larger corrective pattern. Since then, price action has become increasingly interesting as crude oil starts to break beneath key support levels.
Crude oil is in a bit of a tricky position and has been trading sideways for quite some time now. We have been tracking an abcde triangle within wave B for the last two to three months, which may have actually completed back in May, unless the alternative scenario remains in play.
Now that the market is breaking below the lower triangle trendline, we should watch for additional weakness within a higher-degree wave C decline that can unfold as a lower-degree five-wave bearish cycle. In fact, crude oil may already be in the middle stages of wave (3), which is typically the strongest segment of an impulsive move.
The latest weakness accelerated after President Trump said that the United States was close to reaching an agreement with Iran, raising hopes for a diplomatic resolution and potentially increasing future oil supply. As such, traders should be aware of further bearish continuation, while keeping an eye on short-term intraday pullbacks that could offer temporary relief rallies.
However, there is still an alternative count to consider. If crude oil suddenly rallies back toward the 95 area, then the bearish triangle consolidation may still be ongoing, with wave E yet to unfold before the larger downtrend resumes.
For now, the break beneath triangle support gives the bearish outlook the upper hand, suggesting that wave C lower may already be underway.
NZD/JPY BEARISH BIAS RIGHT NOW| SHORT
Hello, Friends!
The BB upper band is nearby so NZD-JPY is in the overbought territory. Thus, despite the uptrend on the 1W timeframe I think that we will see a bearish reaction from the resistance line above and a move down towards the target at around 92.629.
Disclosure: I am part of Trade Nation's Influencer program and receive a monthly fee for using their TradingView charts in my analysis.
✅LIKE AND COMMENT MY IDEAS✅
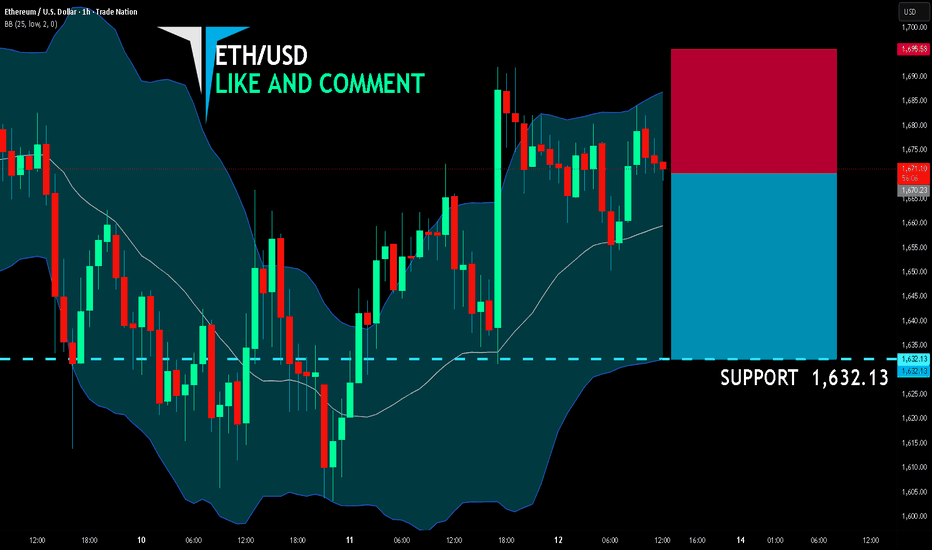
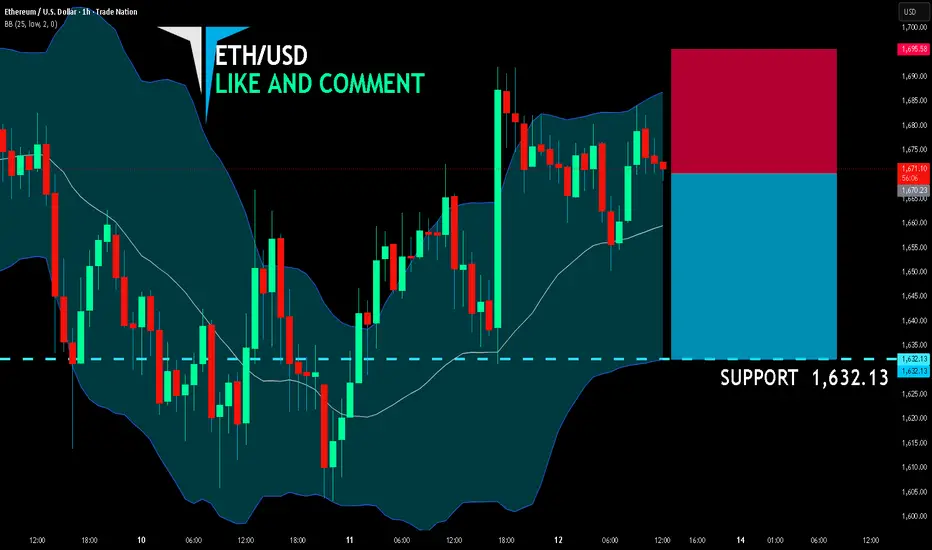
ETH/USD BEST PLACE TO SELL FROM|SHORT
ETH/USD SIGNAL
Trade Direction: short
Entry Level: 1,670.23
Target Level: 1,632.13
Stop Loss: 1,695.58
RISK PROFILE
Risk level: medium
Suggested risk: 1%
Timeframe: 1h
Disclosure: I am part of Trade Nation's Influencer program and receive a monthly fee for using their TradingView charts in my analysis.
✅LIKE AND COMMENT MY IDEAS✅
GBP/NZD BEARS ARE STRONG HERE|SHORT
Hello, Friends!
Bearish trend on GBP/NZD, defined by the red colour of the last week candle combined with the fact the pair is overbought based on the BB upper band proximity, makes me expect a bearish rebound from the resistance line above and a retest of the local target below at 2.286.
Disclosure: I am part of Trade Nation's Influencer program and receive a monthly fee for using their TradingView charts in my analysis.
✅LIKE AND COMMENT MY IDEAS✅
GBP/CHF SHORT FROM RESISTANCE
GBP/CHF SIGNAL
Trade Direction: short
Entry Level: 1.067
Target Level: 1.065
Stop Loss: 1.068
RISK PROFILE
Risk level: medium
Suggested risk: 1%
Timeframe: 1h
Disclosure: I am part of Trade Nation's Influencer program and receive a monthly fee for using their TradingView charts in my analysis.
✅LIKE AND COMMENT MY IDEAS✅
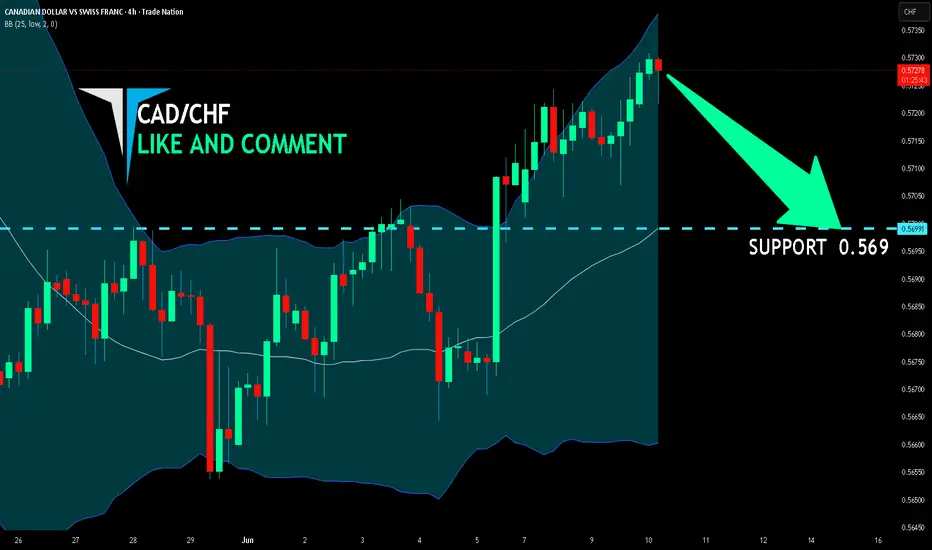
CAD/CHF BEARS ARE STRONG HERE|SHORT
Hello, Friends!
We are targeting the 0.569 level area with our short trade on CAD/CHF which is based on the fact that the pair is overbought on the BB band scale and is also approaching a resistance line above thus going us a good entry option.
Disclosure: I am part of Trade Nation's Influencer program and receive a monthly fee for using their TradingView charts in my analysis.
✅LIKE AND COMMENT MY IDEAS✅
Complacency is at extreme levels. Expect a sharp selloff. The put-call ratio is a measure of sentiment in the market and it's signaling extreme complacency. This is a sign to be bearish. These extreme readings have typically led to sizable corrections so I expect the same this time as well. I'm assuming at least a 10-15% selloff, most likely to the march lows.