Bullish Bat Breakout: EURNZD Trade IdeaHello traders, I hope you're all doing well. Below is my analysis of the EURNZD pair and a detailed plan on how I intend to capitalize on this trading opportunity.
1. Pattern : Bullish Bat on EURNZD.
2. Completion : The pattern reaches completion at point D, which is approximately at 1.81178 on the chart.
3. PRZ Zone : The potential reversal zone for considering long positions, in anticipation of a bullish reversal, spans about 100 pips, ranging from 1.8185 to 1.80758.
4. Target Levels
Bullish Bat
USDJPY Analysis: Opportunities for Shorting EnthusiastsUSDJPY is still pretty bullish, but for those looking to short, here's what I'm watching:
Daily Chart:
- Signal : Retest of the broken trendline
- Entry : Wait for MCC
1-Hourly Chart :
- Bearish Deep Gartley Pattern at 157.33
- Conservative Entry : Wait for MCC, preferably a retest on the PRZ (Potential Reversal Zone) with RSI Divergence
What's your trade plan for USDJPY? Comment down below and share your thoughts!
Happy trading!
AUDUSD Trade Setup: Harmonic BandsA lot of traders aren't familiar with Harmonic Bands ; to be fair, they don't appear frequently.
Here's what I'm looking at:
AUDUSD H4 Chart:
- Short Entry: 0.6666
- Long Entry: 0.6600
Target on the opposite end.
What's your trade plan for AUDUSD? Share your thoughts and strategies in the comments below!
Happy trading!
Understanding Bearish and Bullish Bat Harmonic Patterns
Understanding Bearish and Bullish Bat Harmonic Patterns: A Professional Guide for Traders
In the dynamic world of trading, identifying potential reversal points is crucial for making informed decisions. Two powerful tools that professional traders often rely on are the Bearish and Bullish Bat Harmonic Patterns. These patterns, grounded in Fibonacci ratios, offer insights into market behavior and help in predicting price movements. This article delves into the intricacies of these patterns, p
AUDCHF: BULLISH BAT SPOTTEDHello Traders,
Trust trading has been great for you all. Here is my brief analysis of the AUDCHF pair.
The AUDCHF pair shows a bullish bat pattern, indicating a potential upward reversal. This pattern was spotted in February and has been responsible for the upward rally noticed on the pair since the first week of February. There appears to be more room to the upside on the pair.
Key points : X: 0.53416, A: 0.72599, B: 0.64114, C: 0.69243, D: 0.56181.
My Expectation : Price to rise from 0.59
Wheat Holding at the PCZ of a Bullish Bat Aligning with SupportWheat 2 years after topping out at the PCZ of a Bearish Shark that initiated a downtrend in 2022, has now come back to the top side of the range wheat traded in between the years of 2016 and 2020 before ultimately confirming the bottom at the PCZ of a Bullish Deep Gartley in 2019 and breaking free to the upside of the trading range in late 2020.
Now that wheat has found its way back down here at this previous resistance zone, we can see that it has formed a Bullish Bat structure on the way down
Buying Opportunity on NZDUSDThis week, I'm eyeing a potential buying opportunity on NZDUSD, and here's my trade plan:
1. Bullish 5-0 Pattern on Weekly Chart: The NZDUSD is currently in the zone of the Bullish 5-0 Pattern on the Weekly Chart, signaling a potential buying opportunity.
2. 4-hourly Chart Setup: The 4-hourly chart presents a candlestick confirmation at the Potential Reversal Zone (PRZ), indicating a possible entry point for long positions.
3. Confirmation with 3-Bar Reversal: Despite the candlestick co
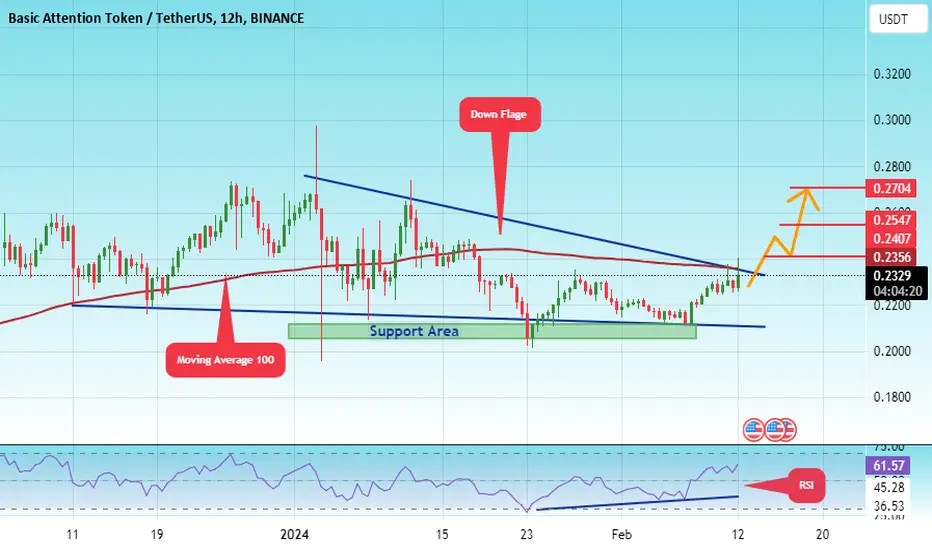
#BAT/UST#BAT
The price is moving in a bearish flag on the 12-hour frame
We also have a good penetration and therefore we seek stability
above moving average 100
We have a major support area at the 0.2100 level
We have a positive divergence on RSI
Entry area 0.2330
The first target is 0.2356
The second target is 0.2547
The fourth target is 0.2704
Harmonic on Harmony x2 - Bullish Bat Long $ONELSE:ONE has completed a bullish bat and sprung above the prior resistance, which is a historical key level, it is now testing that resistance as support.
It is possible that we go back down to the pcz of the harmonic to complete a type two return, hence why the stoploss is below that pcz. Having said that we are in an actionable area now so we plan to monitor it closely, potentially adding to our position should we retrace to the pcz.
Daily is also showing potential bullish divergence.
AUDNZDIs AUDNZD getting bid after massive sell rally?
As the price is been on strong bearish trend but now it seems like price is getting some bullish momentum after reaching at support level and simultaneously has completed bullish harmonic pattern.
If the bulls took control , the 1st target could be 1.07500 followed by 1.0800.
What you guys think of it?
Natural Gas Futures Bullishly Diverging at a Bullish Bat PCZNatural Gas Futures aggressively gapped down into support during the first hour of this week's trading and looks to be ready to form some MACD Bullish Divergence leading into the rest of the week. I think there is a good chance that Natural Gas at least undoes this decline and rises back up to $2.5 this week, but overall if this ends up being a major bottom I'd expect it to pump well into the mid to upper 3 dollar range.
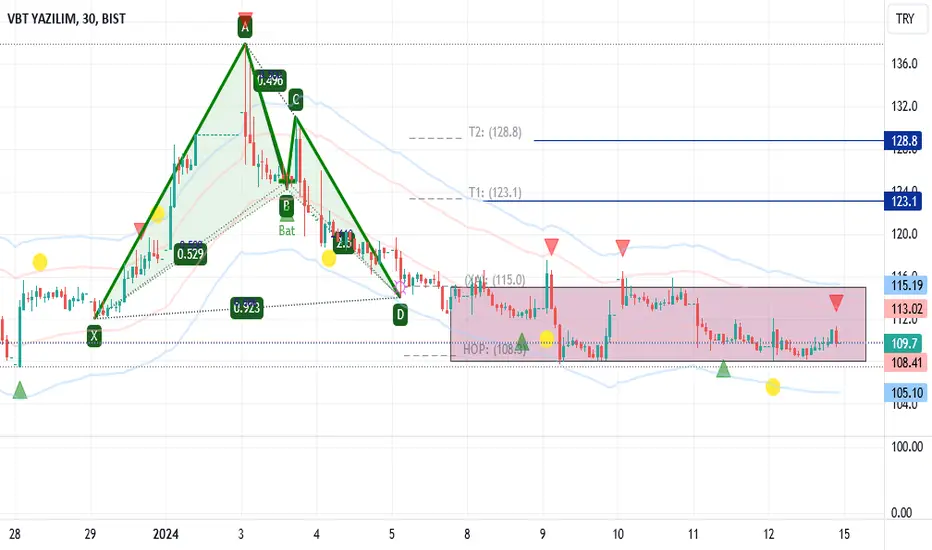
Marathon Oil Corporation: Bullish Bat with Bullish DivergenceMRO on the intraday is showing signs of Bullish Divergence on both the MACD and RSI at the potential HOP level of a Bullish Bat. If this plays out I think it could make a move up towards $25
MLong
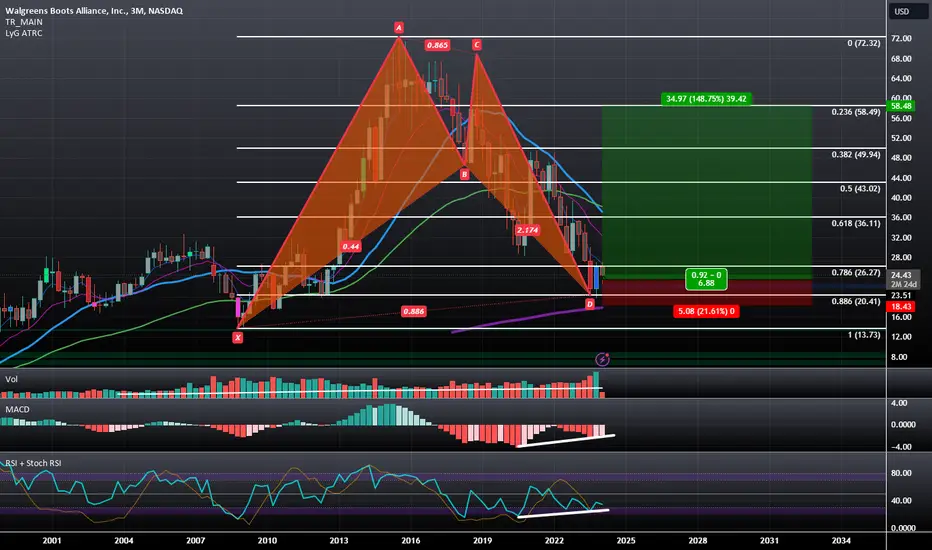
Walgreens: Quarterly Bullish Piercing Line at PCZ of Bullish BatThere is a Bullish Piercing Line at the PCZ of a Bullish Bat that is visible on the Quarterly time frame. We also have MACD and RSI Bullish Divergence to go along with it as well as Increasing Volume. This could be the start of something big for the price action and I speculate that shares of Walgreens could rise up to around $58 over the coming months.
WLong
PEPECOMMUNITYUSDT: 4 Hour Bullish Pinbar with Bullish DivergenceThere is a 4 Hour Bullish Pinbar with MACD Bullish Divergence at the PCZ of a Bullish Bat at the macro low.
PLong
Decoding Hidden Opportunities for a 1,000USD Profit!At first glance, GBPAUD might not catch every trader's eye due to the consolidation observed on the daily chart.
However, upon closer inspection, there's more than meets the eye! A Bullish Bat Pattern unveils itself on the 4-hourly chart.
And for those keen on joining the bullish trend, the 1-hourly chart showcases a potential Head and Shoulders pattern that might exhibit a 3-bar reversal around 1.9058.
What's your trading strategy for GBPAUD? Or are there other trades catching your attentio
Dive into GBPUSD Trading InsightsGBPUSD currently exhibits a Weaker Bullish Trend on the weekly chart, introducing interesting dynamics.
On the 1-hourly chart, a bearish shark pattern emerges, presenting a counter-trend trading setup. Simultaneously, the 4-hourly chart showcases a bullish bat pattern within the buy zone.
My preference in this scenario is clear—I favor the bullish bat pattern on the 4-hourly chart.
Now, I'm curious about your preference. What's your take on these setups? Feel free to share your insights below
Money Making Opportunities in EURUSDEURUSD is currently navigating a weaker bullish trend on the weekly chart, adding an interesting layer to the market dynamics.
On the daily chart, a bearish flag pattern setup unfolds, creating an intriguing scenario. Furthermore, the 1-hourly chart reveals a bullish bat pattern, while the 4-hourly chart showcases a bearish bat pattern.
In the week ahead, I'm poised to engage in whichever trading setup comes to fruition first.
Now, I'm keen to hear about your trade plan. Do you carry any tren
Capitalizing on the Bearish Trend
The entirety of the NZDUSD landscape is signalling a potential shorting opportunity.
Technical Insights:
The volatility trendline, once a counter-trend reference, has been breached and closed below. Now, we await a retest of this trendline as an entry point for a shorting opportunity.
Extended Target:
For those inclined, extending the target to the completion of the Bullish Bat Pattern on the Weekly Chart at 0.5626 could be a strategic move.
Always employ your own risk m
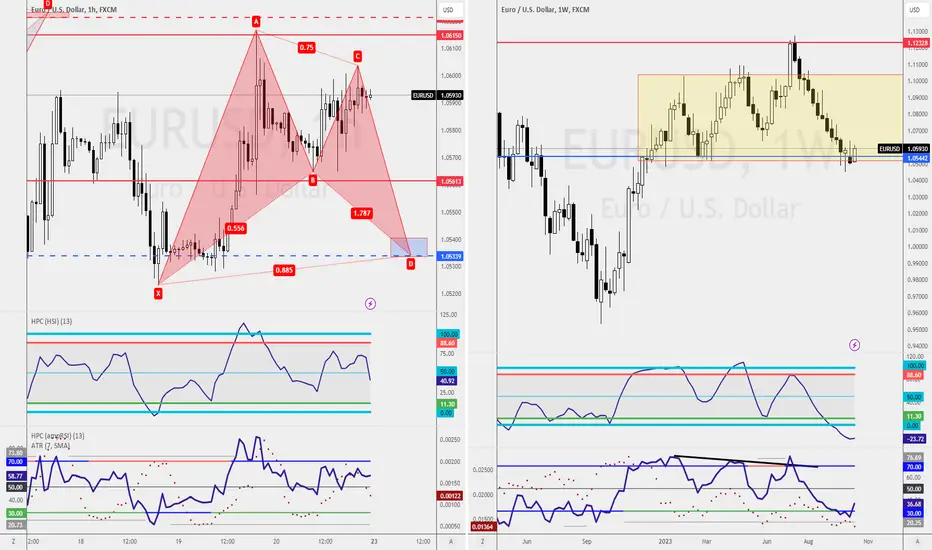
Bullish Trend Perspective
Weekly analysis indicates a sustained bullish trend for EURUSD.
Trading Strategy:
Monitoring the 1-hourly chart for a potential Bullish Bat Pattern with an entry point at 1.0533.
Cautionary Note:
It's crucial to observe that point C touches point A in the formation of the Bat Pattern. This warrants caution and prevents me from placing a pending order to engage the trade.
Remember to conduct your own due diligence and manage risks appropriately. Happy Trading!
Strong Bullish Trend for High Returns!The USDJPY is currently experiencing an upward trend. To capitalize on this trend, I plan to wait for a chance to buy at the Fib-3 Bat Pattern completion on the 1-hourly chart at 149.09.
However, it's important to note that both the 4-hour and daily charts show a Bearish Harmonic Pattern that completes at a similar level of 150.41. As such, it would be best to wait for a candlestick pattern completion before considering a counter-trend trade.
📈🚀 Exciting NASDAQ Buying Opportunity! 🚀📈Fellow traders, listen up! We've got a promising setup on the 4-hour timeframe for NASDAQ that's worth your attention:
📌 Technical Analysis Highlights 📌
💰 Reversal Strategy: After securing nearly 1000 points with short positions, it's time for a strategic shift towards buying opportunities.
🦇 Bullish Bat Pattern: The price action has completed the D leg of a bullish bat pattern, signaling the potential for a bullish reversal.
📈 RSI Confirmation: The RSI is in highly oversold territory, provid
A Great Trading OpportunityAs per my analysis, a Fib-3 Bat Pattern is about to complete at 1.8979 on the Daily Chart. To minimize the initial risk, I will wait for a buying opportunity on the H4 or H1 chart. This will significantly reduce the stop-loss to 1.8733 (-246pips) or close to -2,460usd/lot, while the first target will be at 1.9363 (+384pips) or close to 3,840usd/lot.
I believe that a good trader follows a good mentor, but a great trader plans his own trade and takes reference from others' analysis. Therefore, I