EURNOK: Ascending Broadening Wedge Potential Partial RiseWe have a potential Partial Rise at a 61.8% Retrace within an Ascending Broadening Wedge Pattern on the EURUSD with a Bearish PPO Confirmation Arrow.
If we hit the Demand Line from here, it is very likely it will break down and hit the Measured Move Target down at 7.22
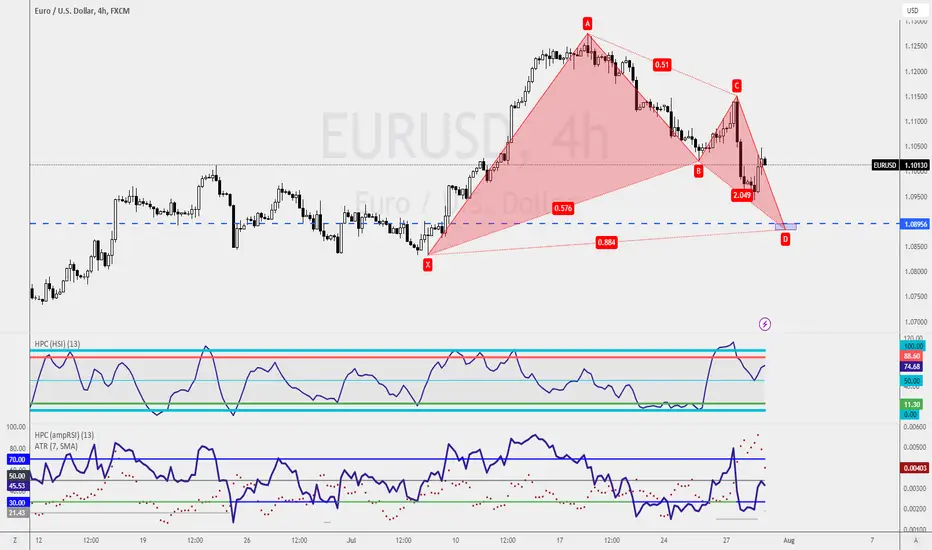
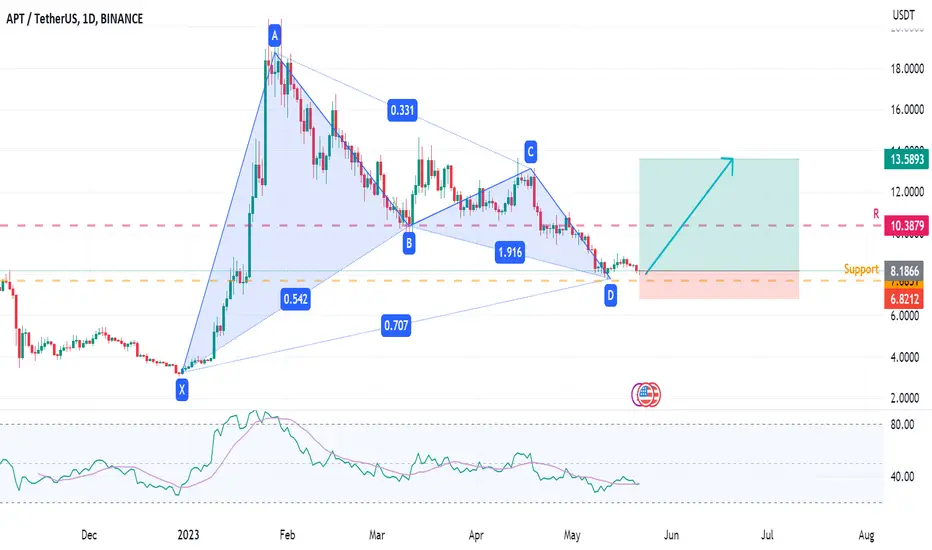
Bullish Bat
Immediate Trading Opportunities AwaitDon't let Monday's reputation of slower market movement deceive you! This week, four immediate trading ideas present themselves right at the market's open. Many traders might overlook these due to the common notion that Monday trading is sluggish. Avoid this pitfall by conducting your analysis over the weekend. Stay ahead of the game and seize these trading prospects.
Canadian Dollar vs. Japanese Yen
Turning to the Canada Yen pair, the weekly chart shows a retest of the previous high, indicatin
📈 Navigating Euro-Dollar Trends: Trading Insights 📉Greetings, fellow traders! Let's delve into the Euro-Dollar trends and identify some potential trading opportunities. 🌍💱
📊 Weekly Chart Insights 📊
The bullish trend continues with a notable pullback, keeping our attention on the upswing. The market's pullback has tactfully avoided breaking crucial support at 1.0637. Transitioning to the daily chart, we find ourselves back in the buy zone.
🔍 Spotting Entry Points 🔍
For those eyeing a buying opportunity, a bit of patience might be wise as we awa
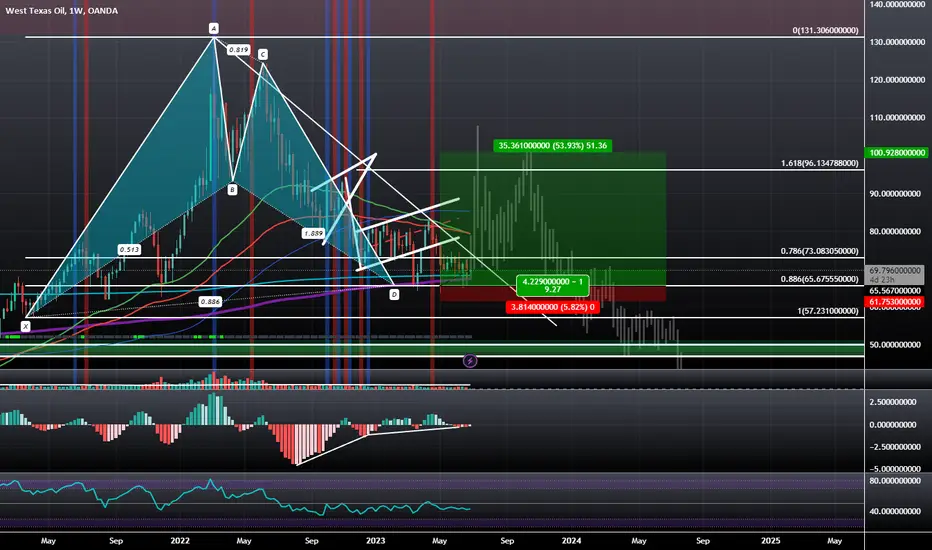
WTICOUSD: Triple Bullish Divergence at Bullish Bat PCZWe have a Triple MACD Bullish Divergence at the PCZ of a Bullish Bat that happens to align with the 200-Week SMA and the 800-Week EMA. I have generally been bearish on this chart since the highs back in 2022: but the persistence it's shown at this Harmonic and Technical level of confluence makes it hard to ignore the potential for at least a 50% move up back to the level of $100.
The 1.618 is at the level of $96.13 but usually if price gets that close to $100, the asset ends up hitting $100,
NAS100NAS100 has completed Bullish bat pattern at very strong support zone with bullish divergence as well. If we put all these confluences together ,Then NAS100 is must due for strong bullish correction.
What you guys think of it ?
N
$LINK; LONG SETUP- PENDINGHello friends,
This is a free of charge BIST:LINK setup for everyone to share and enjoy. However, this is PENDING and AWAITING for more confirmation. I will update all when the trade is a go and or no go.
Arguments- A beautiful bullish pat pattern has flew from the caves and printed a local double bottom right around the .786 fib which is the GOLD standard when looking for areas of potential reversal.
Now, we are above a infliction point, HOWEVER it is still awaiting that confirmation hence
NZDJPY VS NZDUSD📈💹 Expert Level Trade Ideas: New Zealand Yen and New Zealand Dollar!
🇳🇿🇯🇵 On New Zealand Yen, we have an overall uptrend movement. Daily chart shows a bit of pullback. Four-hour chart indicates increased volatility with new lows and highs. One-hour chart has a retest of previous support level with a bit of RSI divergence.
🔍 Trading Strategy: Hidden trading opportunities within this chart can be spotted if you know the trading rules. Scan the QR code to learn more and share your findings in our
ETHUSD: Building Up to a Minimum 66% DeclineEthereum, after having been denied at the local ABCD PCZ, has begun to set itself up to continue its macro move down. All it has to do is break below the $1800 level, and that would be a breakdown of the ascending channel and the weekly 55EMA and 89EMAs. The PPO has already broken below trend and confirmed a lower high and is now working on breaking below the 0 line. The expected target would be the 0.886 retrace, but given the log setups that I've posted in the past, it could go much lower as t
Time to Plan Your Currency Exchange!If you're planning a trip to Australia in the next few months, consider changing some Aussie dollars now. For counter-trend traders, it's a great opportunity to look for a buying opportunity in the AUD. Let's analyze the charts!
📊 The market hit resistance and is now in consolidation, making it a concern for buyers. The daily chart shows an M Formation, with the 0.6600 level as a critical watch. It's likely to be violated before any potential reversal. On the four-hour chart, wait for a buying
📈 Master the Bullish Trend: Earn Income with Effective Trading 📈 The Euro dollar has shifted from a bearish to a bullish trend. On the weekly chart, we can see a violation of the previous resistance, indicating the overall trend is now bullish. However, this doesn't mean you can't consider shorting opportunities, just be more conservative with your targets.
🔍 Moving to the daily chart, the bullish trend is evident, and the RSI near the bottom signals a potential buying opportunity soon as the market is oversold. On the 4-hour chart, those trained in readin
Bullish Bat Pattern within Buy Zone📈 CADJPY Bullish Bat Pattern 📈
Exciting opportunity on CADJPY! 🦅 A Bullish Bat Pattern is forming within the buy zone. 📊 Conservative traders target 106.79, while adventurous traders set their own targets. Remember to manage risk and stay informed. Follow @raynlim for more trading insights. Happy trading! 🚀
EURAUD sell to buy projectionPrice grabbed sell side liquidity and then broke structure on the 4h. Price broke minor sell structure, higher low, and is currently retesting, I’m trying to catch a 78% retracement to enter the sell. I believe the sell is to complete the buy retracement that broke structure to the buy side, also expecting price to sell down to the 78% as there is an OB there. As price gets to that OB, I want to see a lower tf change of character. Please let me know what you think and what you see!
Bullish view on GoldThe weekly chart shows a solid support level at $1919.36 and resistance at $2016.26.
Excitingly, a Potential Bullish Flag Pattern on the 1-hourly chart signals a potential buying opportunity at $1954.80. Brace yourself for a substantial market movement! 🌟💰
Personally, I'm keeping an eye on a Bullish Fib-3 Bat Pattern forming at $1951.93, with a stop-loss set below $1949.10.
Remember, don't follow blindly—make your own trading decision. 🧠💼
AUDUSD Alert! Double Bottom Formation: Bullish Breakout📈🐨🚀 It's time for a change in direction! After a successful short entry based on the breakdown of an ascending channel, we are now shifting gears to capitalize on a bullish opportunity on the AUDUSD forex pair.
The price action on AUDUSD has formed a double bottom pattern, with a retracement to the 0.618 Fibonacci level acting as a strong support. This pattern signals a potential bullish breakout, presenting us with an ideal chance to ride the upward momentum.
Moreover, our last short trade play
Great Wins on WTI💰 Celebrating two great wins on WTI in June! But let me clarify, I'm not chasing streaks—I focus on proper setups. Let's dive into the current situation for WTI, aka US Oil.
📈 The market is testing the support line on the weekly chart. While some traders see it as strong support and anticipate buying opportunities, multiple retests increase the likelihood of a break. That's why my highest priority is shorting WTI and monitoring key levels.
⏰ On the 4-hourly chart, I'm cautious about shorting a
WTI H4, Bullish Shart RetestThe Bullish Shark Pattern has formed on the 4-hourly chart. It is a retest of entry; the setup looks legit, its potential returns tempt me
If you are interested in getting involved, the entry price is at
EP: $67.67(buffer $2.50)
ISL: $66.55($-1.12)
TP1: $70.31($2.64)2.35
TP2: $72.15($4.48)4
Do your own analysis, and do not follow blindly.
At 9.30pm(SGT), approx 6hours from posting, there's a lot 4 major Central Bank Gov. speaking.
BOJ, BOE, ECB President,Fed Chair
If the situation permits
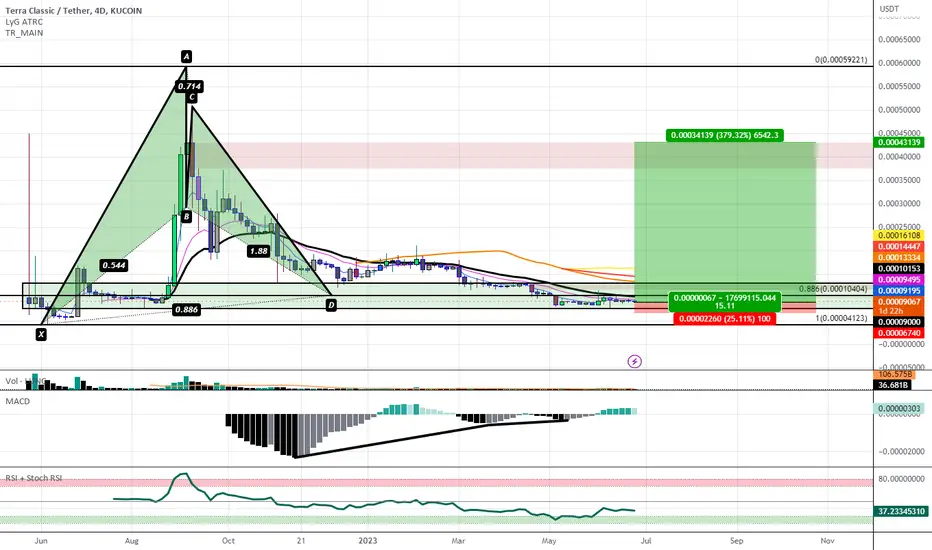
LUNA Classic: Bullish Bat PCZ at Congestion ZoneLUNC was sent down to this support level after breaking through the B level of the Bullish Bat and confirming the breakdown with a Bearish 5-0, as seen here:
Even as the rest of the market has risen, LUNC continued its downward path to the support zone, and now, just as the rest of the market looks like it wants to take a break, LUNC has finally settled down within the support zone and has formed two levels of MACD Bullish Divergence as the RSI went to the oversold zone.
We might see LUNC do
Correlation Matters No More
For the longest time, I've been saying that the correlations between the currency pairs have been weakened.
Traders have asked me why I have NZDJPY and NZDUSD in my portfolio. Doesn't it move in the same direction?
Over the years, these correlated pairs move pretty differently. And recently, the WTI and Gold have no longer moved in an inverse relationship.
So yeah, I'm treating them as their own.
Although both the 4-hourly and 1-hourly charts show buying opportunities through a potential B
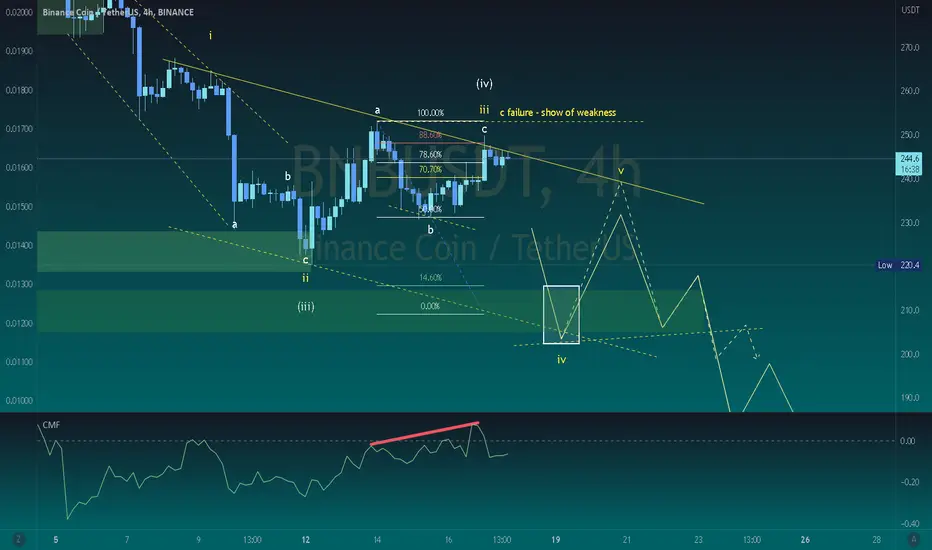
BNB c-wave failure plus CMF bear divergenceBNBUSDT is heading a potential downward leg to complete iv-wave of this channel. On the 4H chart we can see a strong bearish correlation between the price action and Chaikin Money Flow bearish divergence, in which we have a c-wave failure case. The next demand zone is confluent with the Fibonacci retracement projection.
Binance Coin BNB - Going Bull - Last CrashBinance Coin doesn't seem to show the same Bearish patterns as the rest of the Cryptocurrencies.
It appears that it's one step behind on the Bearish Stance.
But can start flying now? YES!
It met all the necessary requirements.
However, if another last bear leg comes, it might as well catch up and reach the Demand Zone in a fast manner.
I'm saying that because when this "thing" drops, it does massive candles.
So, I'm taking my time with BNB .
An awesome level would be $80 , a dream come true f
Seizing the Bullish Momentum with Fundamental Backing! 🚀📈Calling all traders! Get ready for a thrilling opportunity in USOIL (Crude Oil) as we present a compelling bullish setup that is further supported by fundamental analysis. This combination sets the stage for potentially lucrative gains! 💰💥
In the 15-minute timeframe, price retraced to the critical 0.618 Fibonacci retracement level, known for its significance in trend reversals. The bounce from this level indicates the formation of a new higher low, reinforcing the bullish case.
But wait, ther