FET/USDT Bullish Setup
FET/USDT is showing **two bullish harmonic patterns** at the same time: a **Bullish Bat** (green) and a **Bullish Butterfly** (yellow).
A **Bullish Bat** is a harmonic pattern that looks for a potential price reversal from a lower support area.
A **Bullish Butterfly** is another harmonic pattern that can signal a possible bullish reversal after a strong decline.
Here, both patterns point to the same area, making the **$0.0777–$0.0900 zone** important to watch.
**Entry:** Look for a bullish
Bullish Butterfly
NKE: 1.618 Bullish Butterfly with RSI Bullish DivergenceNKE is down 71% from the highs with an unfilled upside gap at $157. In this decline NKE has formed some RSI Bullish Divergence at the 1.618 PCZ of a Bullish Butterfly. Given how much NKE has already been beaten down I think that it is slightly more likely for NKE to attempt to find a bottom here especially as it goes into earnings today and if it does I think it could rise to the top of the pattern to $130 and from there maybe even go for the full gap fill at $157 so long as today's earnings do
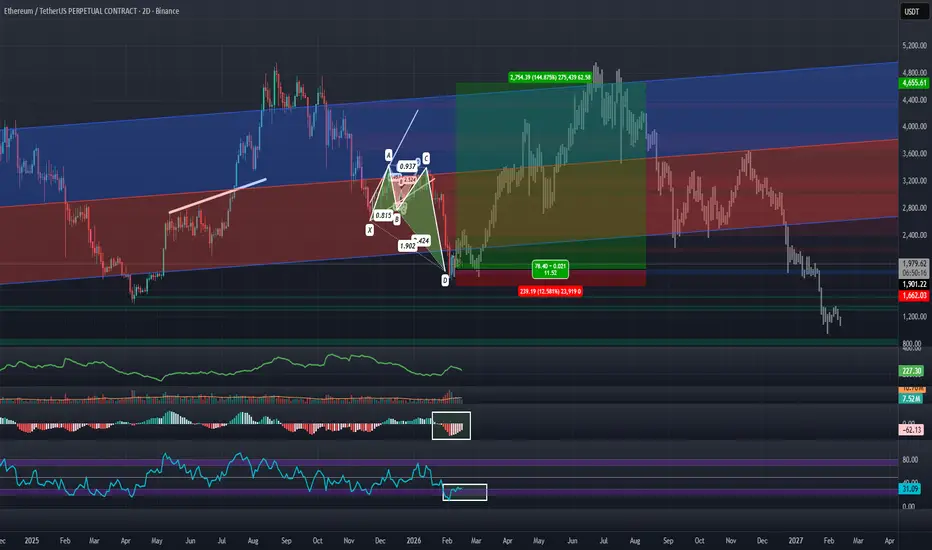
ETHUSD: Bullish Butterfly at HOP with RSI and MACD RecoveringPreviously I shorted ETH via puts on the Grayscale ETHE ETF seen here: But I will now be taking profit on those shorts and looking to long ETH back up to around the mid-top lines of the linear regression channel. I will be doing so off the back of a Bullish Butterfly that has developed on the daily paired with the waning of negative momentum in the MACD, RSI, and what appears to be the start of a decline in the ATR. I think this butterfly can carry us to the line of best fit around $3,400 but c
Bullish Butterfly Pattern Checkback on EURJPYHere’s an interesting setup for all you counter-trend traders out there. A Bullish Butterfly Pattern checkback could provide a solid buying opportunity. Let’s break it down.
Current Overview:
- Bullish Butterfly Pattern: This pattern is setting up a potential buying opportunity for those looking to trade against the trend.
Strategy:
Entry: Look to enter a long position as the market completes the Bullish Butterfly Pattern.
First Resistance Level:
Trendline Break: The first l
XMRUSDT: Bullish Butterfly Update: Bullish Breakout Seems LikelyXMR, despite the spot pairing having been delisted on Binance a few months ago, has survived and held above the PCZ that was of very much importance to the historic price action. During the delisting XMR had sold off back down to the PCZ in record volumes on the exchange, however, in spite of record selling the support still held, since then, the price has stagnated at this level potentially hinting towards accumulation. If the Support had Broken XMR likely would have crashed all the way back do
GBPUSD Update: Potential Bearish Flag Trading Setup IdentifiedTrade Setup:
- Entry: Sell at retest of trendline
- Target: Extended towards Bullish Butterfly Pattern completion zone
- Trade Management: Utilizing upsize trade strategy
Analysis:
While many analysts see consolidation, I've identified a potential Bearish Flag trading setup on GBPUSD. The series of lower highs on the 4-hourly chart indicates a possible continuation of the bearish trend. I'm waiting for a retest on the trendline to execute a short position on GBPUSD. Using my trade manageme
EURUSD Update: Shorting Opportunity IdentifiedTrade Setup:
- Entry: Sell at 1.0797 (Retest Level)
- Target: Extended towards potential Bullish Harmonic Patterns setup
- Risk Management: Implementing trade management system for upsized trades
Analysis:
While many analysts are focused on the potential Bullish Butterfly Pattern and ABCD Pattern on the 4-hourly chart, my attention is on a shorting opportunity using a trade management system. I'm looking to short EURUSD upon another retest at 1.0797, aiming to extend my targets towards po
USDJPY Trading Plan: Fib-3 Bat Pattern Retest and Bullish ButterIn our current analysis of USDJPY, two distinct trading opportunities emerge:
1. Fib-3 Bat Pattern Retest:
- Timeframe: Weekly Chart
- Setup: The Fib-3 Bat Pattern type2 on the weekly chart has already provided a profitable opportunity, and a retest is anticipated.
This pattern has previously yielded a substantial 903 pips in 13 weeks.
2. Bullish Butterfly Pattern:
- Timeframe: 1-Hourly Chart
- Setup: A Bullish Butterfly Pattern on the 1-hourly chart, with an entry point identified at 148.
A Successful Long Trade on Bullish Butterfly PatternThose who went long on the NZDJPY Bullish Butterfly Pattern might have profited more than 100 pips (~1,000 USD/lot).
The trader suggests waiting for a Type 2 Butterfly Pattern at 89.35 or a retest of support at 89.73 for a counter-trend buying opportunity.
What's your trade plan for NZDJPY?
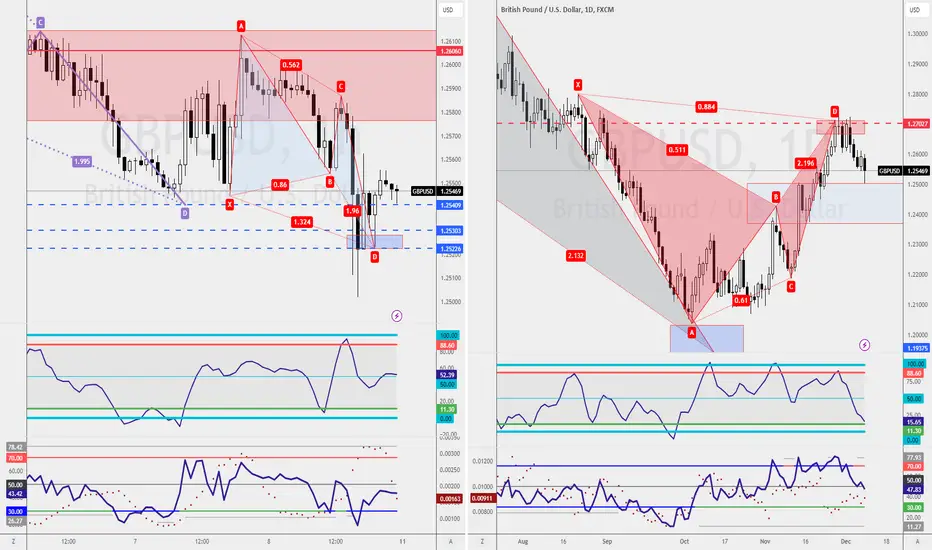
Balancing Bullish Signals And Counter-Trend StrategiesGBPUSD showcases a Bearish Bat pattern on the daily chart, signaling a potential shorting opportunity with a likely retest around 1.2691.
Another approach would be to watch for resistance retesting, aiming for a double top with RSI divergence at 1.2606 on the 1-hourly chart.
However, if you're leaning towards a buying opportunity, considering the Weaker Bull trading setup on the weekly chart, the 1-hourly chart reveals a Bullish Butterfly Pattern.
Keep an eye out for a retest around 1.2522
Mth-long Consolidation for Profits
GBPUSD currently exhibits a Weaker Buy signal, accompanied by a 5-week long consolidation phase.
Trading Decision Dilemma:
The month-long consolidation prompts a crucial decision: Will it be a buying or selling opportunity?
Buying Opportunity:
For those inclined towards a buying stance, watch for the completion of the Bullish Butterfly Pattern at 1.1951 for a potential entry.
Aggressive Selling Approach:
Traders seeking a more aggressive move may consider the Bearish
Japanese Currency Index: Harmonic Bottom with RSI ConfirmationThere is a Confluence of a Bullish Butterfly and a smaller Bullish Bat visible on the 5-day and Weekly timeframes on the JXY as the RSI ticks out of the oversold zone for the 4th time at this level while making higher lows each time. It would seem as if the JXY is confirming to us that it has reached a Harmonic Bottom and is preparing to rise up to some of the longer-term moving averages, with the highest being at around $89-$95. During this time, we have seen the JXY continue to strengthen agai
NZDCAD: Bullish Butterfly Trading at Support in a Falling WedgeWe have some PPO Confirmation at the PCZ of a Bullish Butterfly near a Support Level, along with some Pending MACD Bullish Divergence inside of a Falling Wedge Pattern. I think we are setting up to eventually Breakout of the wedge and get a 10-20% move out of it.
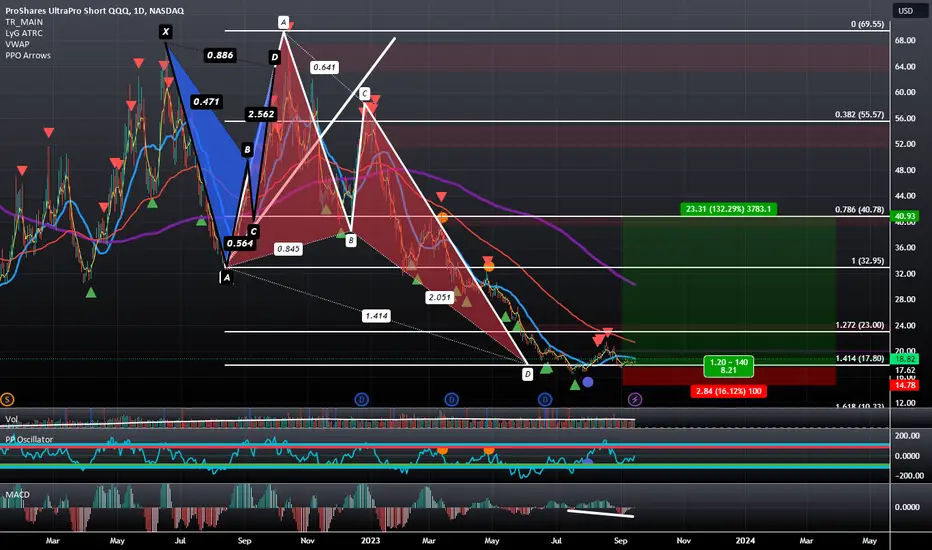
SQQQ: Bullish Butterfly with PPO Circle and MACD DivergenceThe SQQQ has given us PPO Confirmation at a potential 1.414 Bullish Butterfly PCZ and has topped it off with MACD Hidden Bullish Divergence. If we are to see the QQQ pull back 50-65% then the SQQQ should go up about 100-200% from here, though I may end up just targeting $32 depending on how fast it goes.
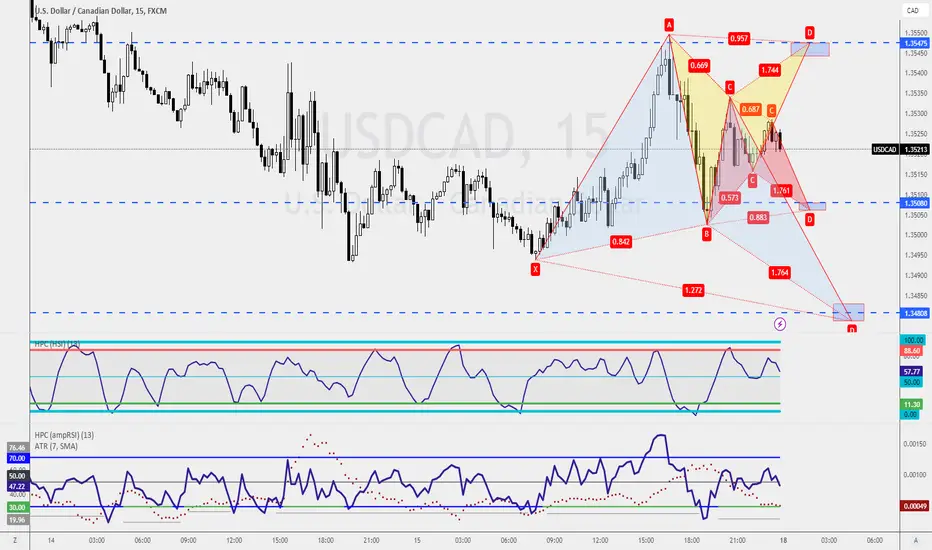
Opportunities Abound!The Dollar Canada pair offers a chance to capitalize on a bit of consolidation after an uptrend movement. Upon examining the daily chart, there appears to be a retest of the previous resistance, indicating a favorable buying opportunity for counter-trend traders.
The 4-hour chart shows a retest of the support area, which could potentially lead to a harmonic pattern on the intraday time frame, such as the 15-minute or 1-hour chart.
On the weekly chart, the Dollar Canada has a fib-3 bat pattern
Bullish Logscale Butterfly With Quadruple Bullish DivergenceA couple years ago BTC topped out with a Bearish Logscale Butterfly and now it may be looking to Bottom out to the Bullish Variant of the same Harmonic. We have a Tripple Bullish Divergence on the MACD and an additional Bullish Divergence on the RSI.
Sideway Consolidation, Perfect for Counter-Trend Traders!📊 If you're a trader seeking both buying and selling opportunities without worrying about trends, this one's for you! Australia-Canada is in a sideway consolidation, ideal for counter-trend traders who love buying low and selling high. 📉📈
👀 On the daily chart, observe the group of highs and lows. The four-hour chart heads towards previous supports, while the one-hour chart shows a new low, great for shorting.
📈 Weekly potential shark pattern at 0.8704, and daily shark pattern at 0.8728, hint a
USDNOK: Confirmed Bullish Butterfly at Structural Demand LineUSDNOK is sitting at the Demand Line of an Overall Bearish Ascending Broadening Wedge Pattern that happens to align with the 1.272-1.618 PCZ of a Bullish Butterfly; along with that, we have PPO Confirmation, RSI BAMM, and a MACD Bullish Crossing. Given the scenario, I can see this trying to retrace up 50-88.6% of the Harmonic Range before coming back down and confirming a partial rise, after which we will then possibly have to look for opposing Bearish signals.
DXY RSI Bullish Divergence at Bullish Butterfly PCZFrom the looks of it, DXY will try to hold the 1.414 Butterfly PCZ and make its way up towards previous Resistance. I don't think DXY will Break the Resistance, but it does look like there is a good case to be made for DXY coming back up to challenge those levels.
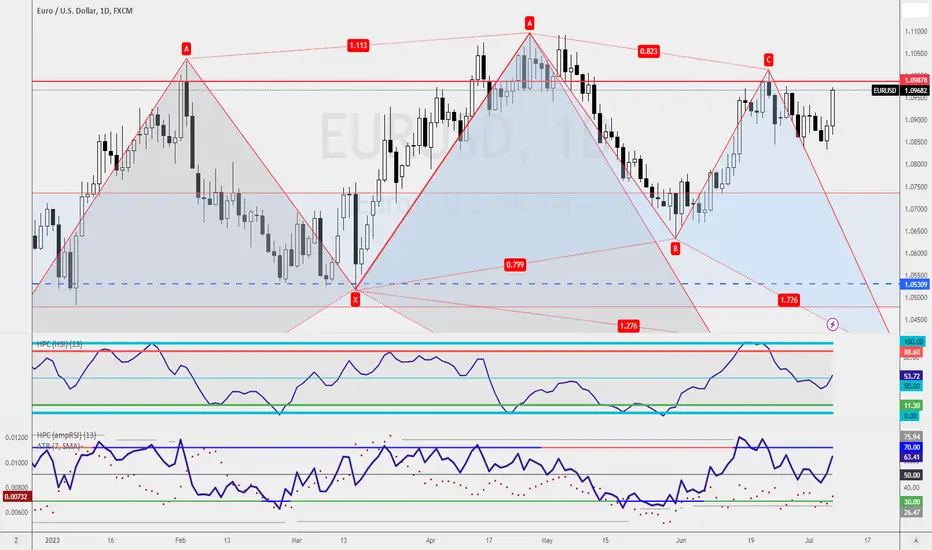
Shorting Opportunity🔍 Take Note! This week's market may experience a retracement, and my focus is on a potential shorting opportunity at the resistance level of 1.0987.
Stay tuned as we analyze the charts and identify the optimal entry points for profitable trades.
Let's navigate the retracement together and seize the right opportunities! 💪📉
IOTA: Bullish Butterfly RSI Bullish Divergence (Final Fib Level)IOTA is currently sitting at the 1.272 PCZ of a Bullish Butterfly and this 1.272 extension happens to be the last positive Fibonacci Extension on the linear scale, meaning that this is probably the least risky area possible to buy IOTA and perhaps aim for much higher levels, even as high as 1–2 dollars.
Given how tight the entry and price action are, I think as long as it holds above 15 cents, we could see it go for some major Bullish targets.
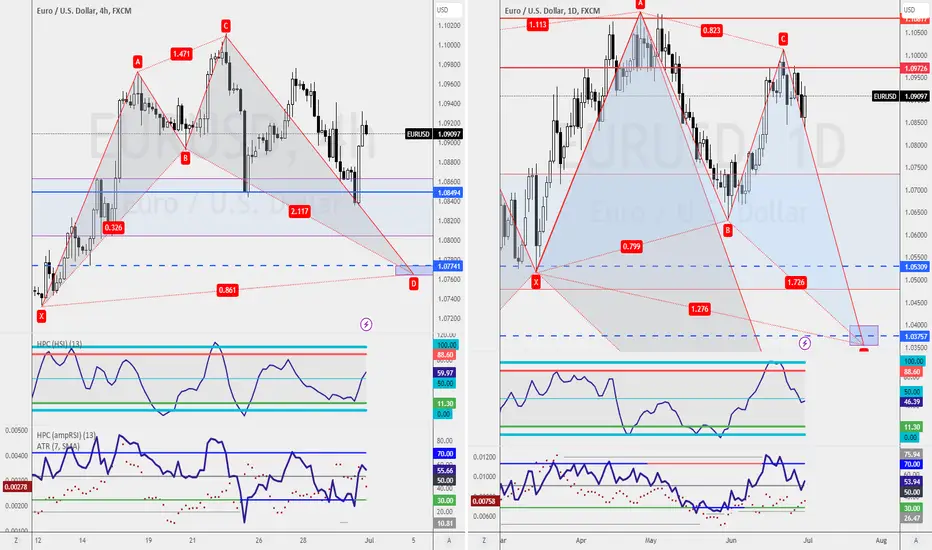
Shorting Opportunity🔍📊 Current Market Overview:
I'm closely monitoring the EURUSD pair for a potential shorting opportunity on the higher timeframe. However, at the moment, two buying opportunities have emerged, which deserve our attention. Let's dive into the details:
🦋 Bullish Butterfly Pattern:
On the daily chart, we have identified a Bullish Butterfly Pattern with completion anticipated at 1.0355. This pattern suggests a potential buying opportunity, indicating a reversal in the price action. It's crucial to k