GOLD - The Hunt for Liquidity (Correction) Before the Drop ICMARKETS:XAUUSD has paused its decline but remains under pressure. Market stagnation could trigger a rebound before another move lower. The key events are the Trump–Xi meeting, oil price dynamics, and Treasury yields.
The fundamental backdrop for gold remains weak. The market could form a correction amid the meeting between the U.S. and Chinese presidents, but the medium-term tone for the metal remains bearish, driven by a strong dollar and rising oil prices. The dollar and major indices are temporarily correcting, which could allow gold to rebound toward the 4,322–4,333 liquidity zone before continuing lower toward 4,230–4,200.
Drivers:
Downside: rising oil prices and yields, dollar strength, hawkish Fed, escalation in the Middle East.
Upside: falling oil prices and yields, softer U.S. data, progress in trade negotiations, de-escalation.
Resistance levels: 4300, 4322
Support levels: 4275, 4250, 4200
Technically, the market remains in a medium-term bearish trend amid the weak fundamental backdrop. Against the backdrop of the upcoming news, gold could retest the 4,320 liquidity zone, while a short squeeze could in turn trigger further downside.
A close below 4,275 would also increase selling pressure, which could lead to further downside toward 4,200.
Best regards, R. Linda!  Short
Short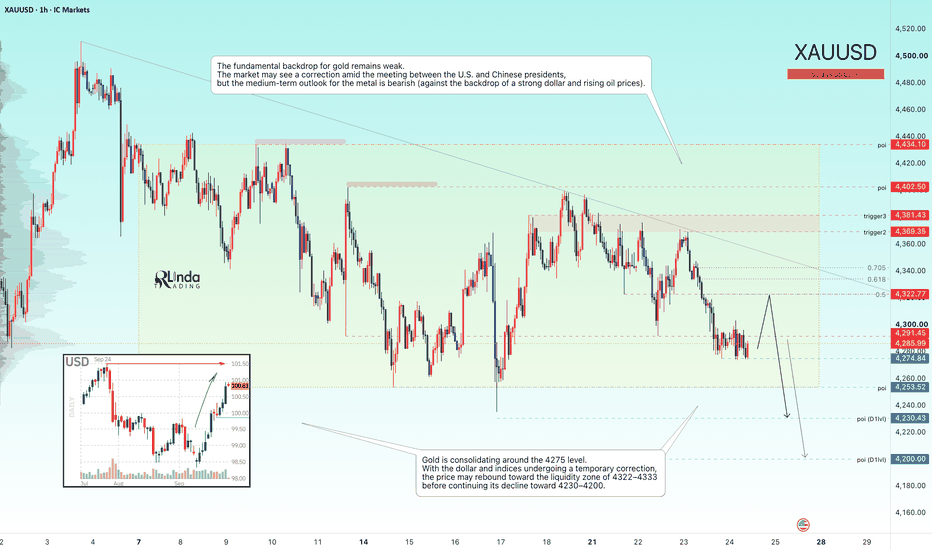
GOLD - Consolidation could trigger a distribution downwardsICMARKETS:XAUUSD is bouncing off the 4,380 resistance and consolidating within a local range ahead of a potential decline driven by the negative fundamental backdrop
The dollar is stagnating but preparing for further upside, while rising interest rates and the weak fundamental backdrop are putting pressure on the gold market. The probability of further downside toward the range support remains in place.
Gold is likely to remain range-bound as long as the conflict in the Middle East does not escalate and trigger another rise in oil prices. Support remains intact, while pullbacks are viewed as buying opportunities. The key events are the Trump–Xi meeting and upcoming Fed speakers.
Drivers:
Upside: further declines in yields, dollar weakness, diplomatic progress, falling oil prices.
Downside: rising oil prices and inflation concerns, hawkish Fed, escalation in the Middle East
Resistance levels: 4,380, 4,400, 4,434
Support levels: 4,334, 4,250, 4,200
A close below 4,334 could trigger further downside. The market remains in a medium-term bearish trend. The key area of interest is 4,250–4,200
Best regards, R. Linda! Short 
GOLD - The Hunt for Liquidity Ahead of a Decline ICMARKETS:XAUUSD continues to form a countertrend correction, driven by the decline in oil prices. The fundamental backdrop remains weak...
The dollar is stagnating after a strong rally triggered by the Fed’s hawkish stance and rising interest rates. However, the Dollar Index remains strong, which continues to put pressure on gold. At the same time, the decline in oil prices has given the metal some room to recover. The market remains highly dependent on geopolitical developments.
There is not much major news ahead next week, with the key focus on PMI data and Friday’s Durable Goods Orders. Technically, gold remains under pressure from the bearish trend
Resistance levels: 4,402, 4,434, 4,511
Support levels: 4,340, 4,250, 4,200
Gold is forming a countertrend correction. The dollar remains strong, while the fundamental backdrop is unfavorable for gold due to the Fed’s hawkish stance and rising interest rates.
Technically, the key focus is on two triggers: 4,402–4,434. A short squeeze could trigger a decline toward 4,340–4,250
Best regards,
R. Linda! Short 
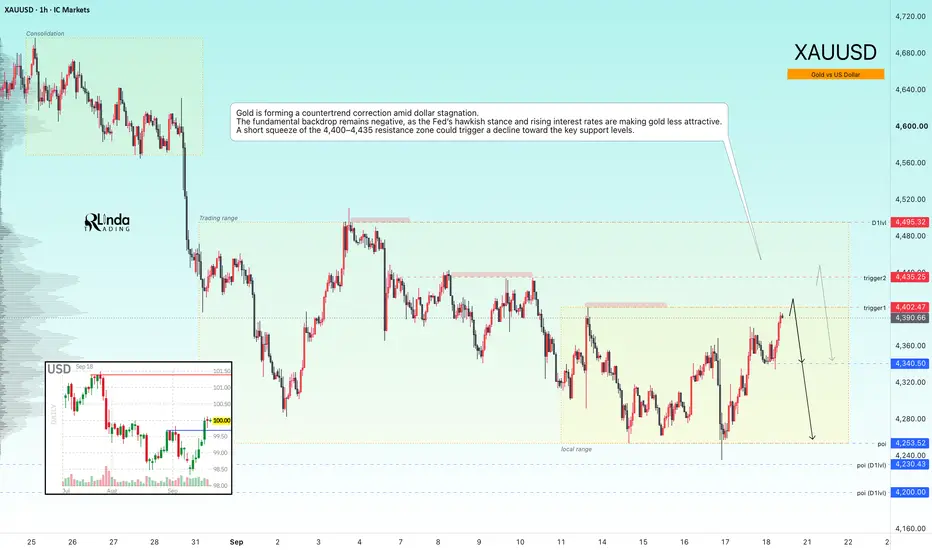
GOLD - A countertrend correction aimed at liquidity huntingICMARKETS:XAUUSD has been forming a countertrend correction toward the 4,400–4,430 liquidity zone since the session opened. The fundamental backdrop remains weak, and the market is still in a bearish trend
The dollar is stagnating after breaking through local resistance levels. The Fed’s hawkish stance and rising rates are supporting the Dollar Index, which is putting medium-term pressure on the metals market. However, the correction in oil prices is giving gold some room to recover as it tests key levels.
Gold is stabilizing, but further upside remains limited by the Fed’s hawkish outlook and geopolitical risks. The BOJ decision and developments in the Middle East will determine the short-term direction
Drivers:
Upside: further declines in oil prices and yields, de-escalation of the conflict, softer U.S. data, dovish BOJ.
Downside: escalation in the Middle East, higher oil prices, hawkish Fed stance, dollar strength
Resistance levels: 4,402, 4,435, 4,495
Support levels: 4,340, 4,253, 4,200
Gold is forming a countertrend correction amid dollar stagnation. A short squeeze of the 4,400–4,435 resistance zone — with the key focus on two triggers — could trigger a decline toward the key support levels. The formation of reversal patterns after the retest could provide a potential entry opportunity
Best regards,
R. Linda! Short 
GOLD - A countertrend correction ahead of the news ICMARKETS:XAUUSD is bouncing from support ahead of the news and forming a countertrend correction amid the dollar’s stagnation following a five-day rally. The FOMC meeting and comments from the regulator are ahead...
Technically, most of the hawkish risks have already been priced in, but gold will remain vulnerable if the Fed signals that it intends to keep rates elevated for an extended period. Geopolitical risks and high energy prices are providing support. Gold is caught between expectations of tighter monetary policy and safe-haven demand.
Technically, the market is moving toward a liquidity zone, which could be tested before another decline within the local trend
Drivers:
Downside: hawkish Fed, strong dollar, rising yields.
Upside: dovish Fed, weak dollar, geopolitical support
Resistance levels: 4,355, 4,402
Support levels: 4,250, 4,230, 4,200
Gold, having failed to reach the key levels at 4,230–4,200, is forming a countertrend correction ahead of the upcoming news — the interest rate decision. A short squeeze of the 4,355–4,400 resistance zone could trigger a decline toward the key areas of interest
Best regards,
R. Linda! Short 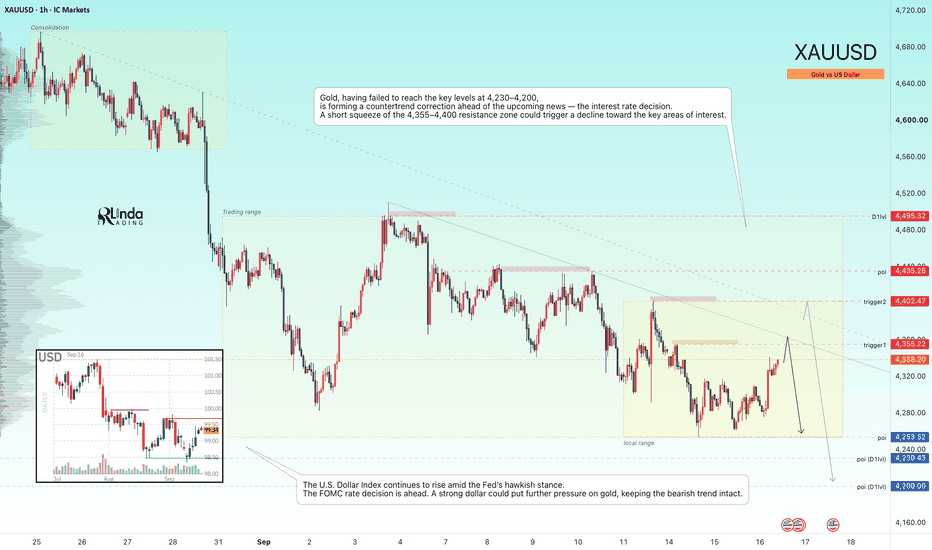
GOLD - A bounce off support before falling to 4,200 ICMARKETS:XAUUSD remains under pressure from the Fed’s hawkish stance and a strengthening dollar. In the medium term, the market may maintain its bearish trend; however, this week, all attention is focused on the Fed’s rate decision and the regulator’s comments
The dollar is forming a countertrend correction but remains locally bearish. The dollar’s rise is putting additional pressure on the metals market. Gold is maintaining its bearish market structure amid the Fed’s hawkish stance, while the market is also pricing in a high probability of a rate hike. Yields at their highest levels since 2023 are reducing the attractiveness of non-yielding gold. Trump’s rhetoric, including his calls for lower rates while acknowledging uncertainty, as well as support for Warsh’s independence, have so far failed to change the overall hawkish stance.
Technically, gold could remain within the current range ahead of the news. A false breakdown of support could trigger a correction toward the liquidity zones before the downtrend resumes.
Resistance levels: 4,345, 4,389, 4,435
Support levels: 4,287, 4,230, 4,200
The market is aiming to test the 2,292–2,287 liquidity pool. As an initial reaction to the retest, the market could trigger a rebound toward the 4,345–4,389 areas of interest and liquidity, followed by another move lower toward 4,200
Best regards,
R. Linda! Short 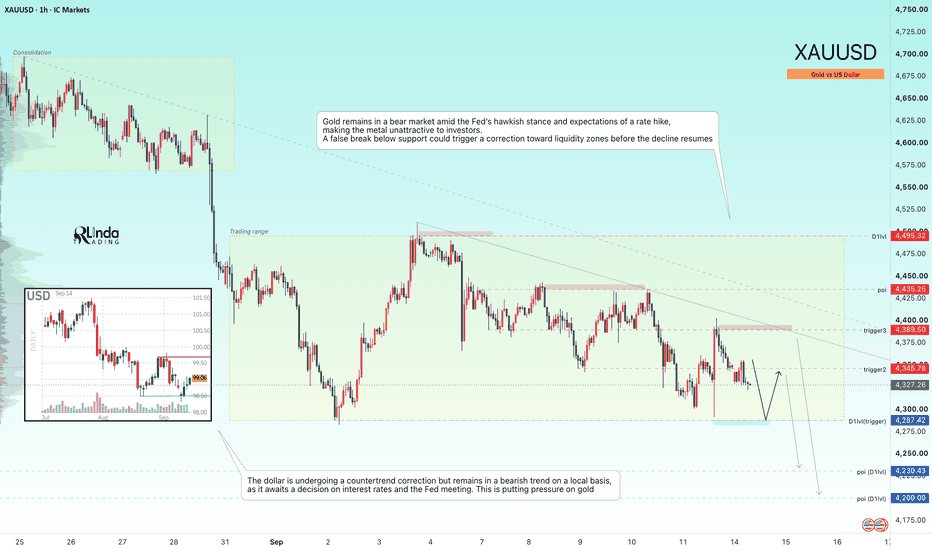
GOLD - A countertrend correction to 4,400 ahead of the newsICMARKETS:XAUUSD remains under pressure from a strengthening dollar and a weak fundamental backdrop. The market is making new intermediate lows within the 4,290–4,500 trading range. Key news is ahead…
The dollar is bouncing from support and returning to its bullish momentum, putting further pressure on the market. Gold is trading near its weekly lows, around $4,310, on Friday following a sharp decline triggered by hotter-than-expected PPI data and rising oil prices.
According to TD Securities, a hawkish Fed may only delay the next move higher in gold rather than trigger a deeper decline, as support remains in place from dollar debasement, central bank purchases, and ETF inflows. The market is now waiting for the key U.S. CPI report.
Drivers:
Upside: soft CPI, dollar weakness, falling yields, central bank purchases, ETF inflows.
Downside: hot CPI, hawkish Fed rhetoric, dollar strength, rising yields
Resistance levels: 4,389, 4,400, 4,435
Support levels: 4,345, 4,300, 4,287
Gold is making new lows but has yet to reach the key target. A countertrend correction is forming ahead of the upcoming news. A short squeeze around the 4,390–4,400 zone could trigger another decline toward the 4,285 liquidity zone
Best regards,
R. Linda! Short 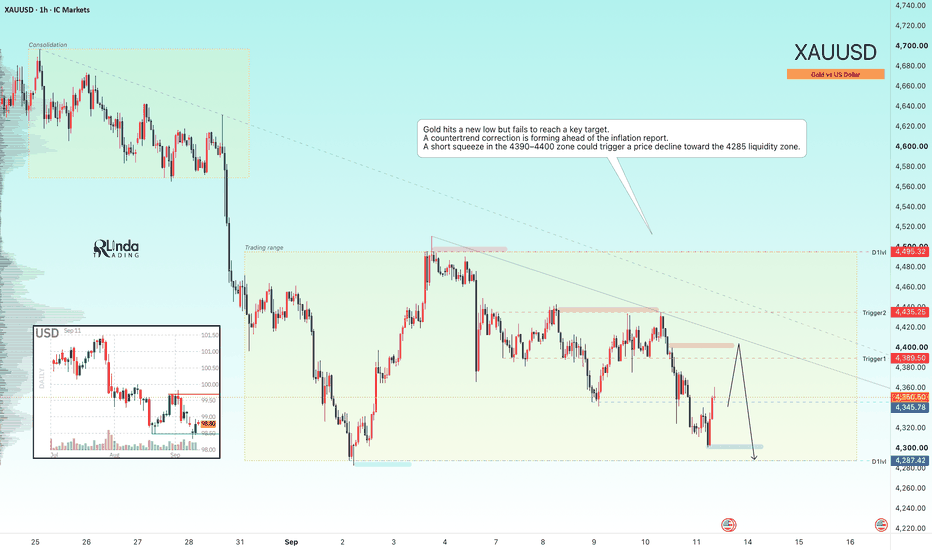
GOLD - A Hunt for Liquidity Ahead of Further DeclinesICMARKETS:XAUUSD has been forming a countertrend correction since the session opened. The fundamental backdrop remains unstable, and this correction could end with another move lower
Gold remains exposed to two-sided risks ahead of the release of U.S. CPI data. The sell-the-bounce strategy remains in place, especially against the backdrop of higher-than-expected inflation in China. TD Securities expects core inflation to remain under control in August but warns of upside risks
Drivers:
Upside: weak U.S. CPI data, dollar weakness, de-escalation of the conflict.
Downside: hot CPI data, dollar strength, escalation of the conflict, hawkish Fed rhetoric
Resistance levels: 4,410, 4,435, 4,461
Support levels: 4,365, 4,287
A weaker dollar, driven by yen strength, is supporting gold. At the same time, however, gold remains under pressure from the Fed’s hawkish stance and geopolitical risks.
Technically, I expect a short squeeze around the 4,430–4,435 liquidity zone, followed by a decline toward range support at 4,365–4,287
Best regards,
R. Linda! Short 
JPN225: Triangle broken, Trade in profit what comes next?In this video is the update to the Nikkei 225 trade idea from 3 September 2026, when Japan’s 10-year bond yield surpassed 3% for the first time since 1996 and the index dropped by 2.85% to its lowest levels in four weeks at 64,325. Entry: 63,000-64,274. Descending triangle was the formation and the contracting MACD histogram which was deep into the negative zone was the trigger;the exact setup that called for the best week for the Hang Seng since March 2025. On 4 September Softbank and AI semiconductor stocks jumped 806 points. On 7 September, thanks to Kioxia and SoftBank the index increased by 2.12% to 66,399. Descending triangle has been violated to the upside and the trade is now making money. However, the chart has formed a new symmetrical triangle inside the rebound phase, and in this video I will show you exactly where this triangle is, where the breakout level is, where the trailing stop now stands, and why 66,250 is the next target level. Whether you trade indices or want to learn how patterns develop during the recovery, this video is for you.  Long
Long

The ADA Breakout MythMyth: ADA/USDT just broke out and the move is still running.
Look at the last 30 bars on the 90-minute chart and that story doesn't hold up. The rally that took price from the low-0.21s to a 0.2321 spike came on a single outsized volume bar, nearly 6x the 90-min average. Every bar since has printed lower highs: 0.2289, then 0.2264, 0.2231, 0.2218. That reads like fade, not continuation.
What the chart actually shows:
A sharp volume spike bar, then immediate rejection at the highs
A descending line connecting genuine lower highs, currently pressing down near 0.220
A horizontal floor of buyers defending the 0.2158-0.2175 zone across five separate tests
Price now squeezed inside a shrinking range between those two lines
Falling highs against a flat floor is the textbook shape of a descending triangle, not a breakout continuation. It resolves one of two ways. A close back above the descending line (~0.220) that holds would argue the breakout narrative was right all along, just early. A break of the 0.2158 floor instead would say the spike was exhaustion, not ignition, and open room back toward the 0.210s.
Worth flagging: volume has been fading through the whole squeeze, which usually favors the downside resolution, but triangles can break either way and this one hasn't committed yet.
Not trading advice, just what the last 55 bars actually say. Which way does this resolve first, up through the ceiling or down through the floor? GOLD - The market is under pressure from a bearish trend ICMARKETS:XAUUSD remains in a local bearish trend, while consolidation below the 4,435 liquidity zone is becoming a technical catalyst for further downside
The dollar is stagnating, but at the same time, it is weakening due to interventions by the Bank of Japan. Gold looks weak against this backdrop, especially given the Fed’s medium-term hawkish stance. Geopolitical risks and inflation expectations that could limit further upside remain in place. The key event of the week will be the U.S. inflation data on Friday, which will determine the next direction.
Drivers:
Upside for gold: further dollar weakness, a stronger yen, weak U.S. CPI data.
Downside for gold: dollar strength, hawkish Fed rhetoric, rising geopolitical tensions (supporting oil and the dollar), strong CPI data
Resistance levels: 4,435, 4,461, 4,490
Support levels: 4,365, 4,320, 4,290
Gold remains under pressure from a weak fundamental backdrop and the local bearish trend. A short squeeze around the liquidity zone is triggering further downside. I do not rule out a retest of local resistance before another decline toward 4,365–4,290
Best regards, R. Linda! Short 
GOLD - Correction and retest of the 4460 resistance levelICMARKETS:XAUUSD continues its rebound after the false breakdown of the 4,300 support level. The fundamental backdrop remains mixed, but selling pressure is still present
The dollar is stagnating, potentially due to intervention from the Bank of Japan. The correction in the Dollar Index is giving gold room to recover. The key event is Friday’s NFP report. A weak report could support a further recovery in gold, while a strong report could bring selling pressure back. The 4,460 level remains the nearest resistance, with 4,300 acting as support.
Drivers:
Upside: weak NFP data on Friday, further dollar weakness, lower yields, technical rebound.
Downside: strong NFP data, hawkish Fed rhetoric, stronger dollar, renewed rise in oil prices
Resistance levels: 4,466, 4,480
Support levels: 4,300
The long squeeze of the 4,300 support zone has triggered a rebound, which has developed into a stronger move amid the dollar correction.
Ahead lies the 4,466–4,480 resistance zone. A short squeeze in this area could trigger a downside pullback, potentially pushing gold back into the range ahead of the NFP release.
The retest of this resistance zone and the market’s reaction to it will help determine the medium-term direction
Best regards,
R. Linda. Short 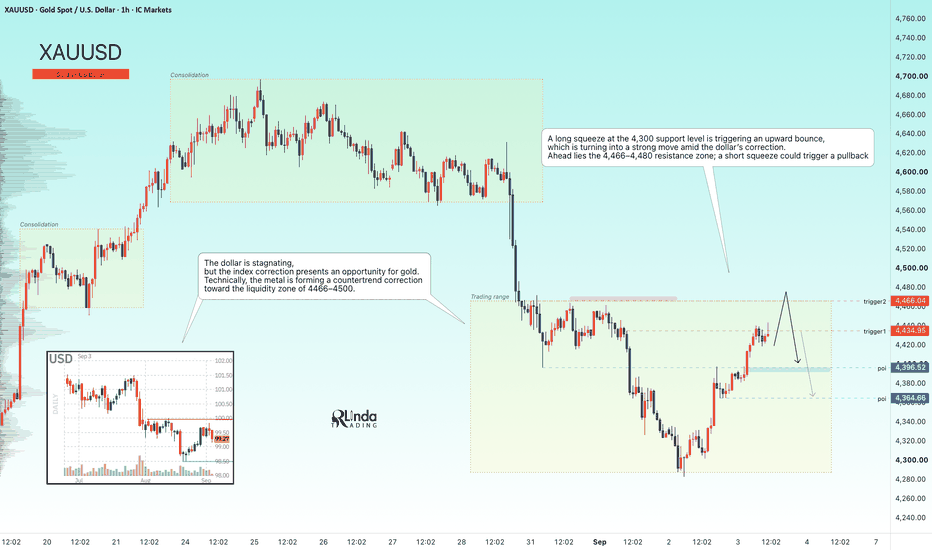
GOLD - Weak fundamentals and a bear market ICMARKETS:XAUUSD remains under selling pressure and continues to decline. Another distribution phase is developing after a short-term consolidation, with the market moving toward the 4,330–4,300 liquidity zone
The Dollar Index looks strong after the Fed adopted a hawkish stance and is bouncing higher, putting further pressure on gold. The medium-term outlook for gold remains bearish.
Gold will remain sensitive to U.S. inflation and labor market data. Central bank purchases and geopolitical risks continue to provide support, but a strong dollar and expectations for higher interest rates are limiting the upside potential. Any recovery attempts could prove short-lived. The key event of the week is Friday’s employment report.
Drivers: hawkish Fed signals, conflict escalation, stronger dollar, rising yields
Resistance levels: 4,400, 4,440, 4,472
Support levels: 4,330, 4,300
A breakout below the support of the intermediate consolidation is developing. Gold is moving toward the 4,330 liquidity zone.
A long squeeze followed by profit-taking could trigger a bounce toward 4,400 before the decline resumes
Best regards,
R. Linda. Short 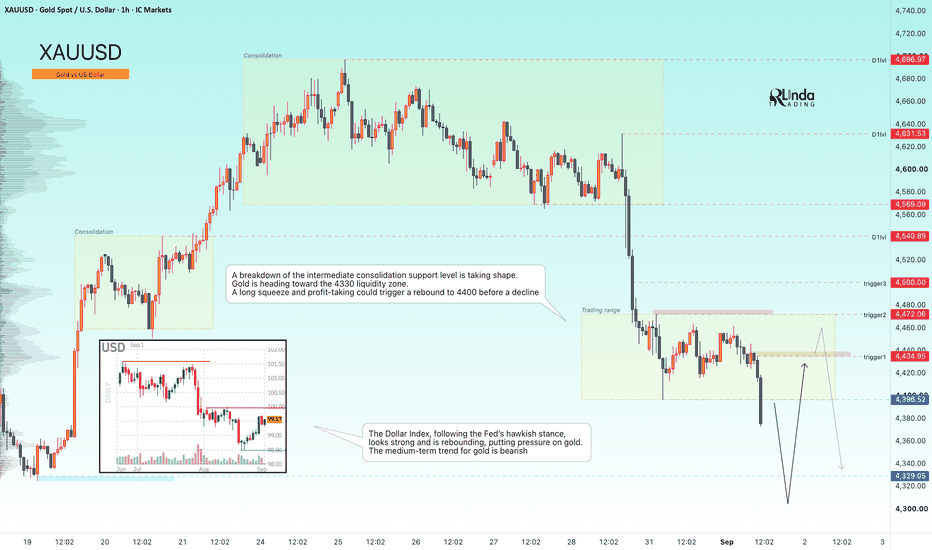
GOLD - A sudden shift in the fundamental backdropICMARKETS:XAUUSD is reacting to the news, specifically the Fed Chair’s speech. The markets have reversed sharply, and the move could continue
Risk-off sentiment has increased significantly following Waller’s hawkish comments. Expectations for a Fed rate hike this year rose sharply on Friday. The strong sell-off was news-driven, and the fundamental backdrop has shifted. The dollar is strengthening, putting pressure on gold. A correction could develop at the start of the session before the decline resumes.
Gold could test the 4,435–4,450 liquidity zone. A long squeeze followed by profit-taking could trigger a bounce toward 4,500 before the decline resumes due to the shift in the fundamental backdrop
Resistance levels: 4500, 4540
Support levels: 4450, 4435, 4394
Technically, I expect a bounce and correction from the 4,435–4,450 support zone toward 4,500. However, from a medium-term perspective, due to the shift in the fundamental backdrop, gold could continue declining toward 4,400–4,300
Best regards,
R. Linda. Short 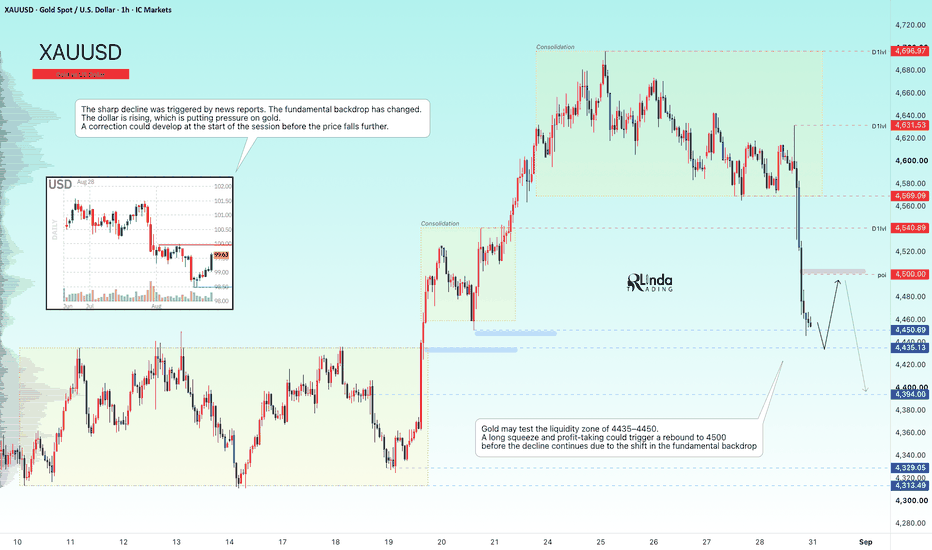
ETHUSDT - Consolidation Before Distribution BINANCE:ETHUSDT is attempting to hold above the 1,850 support level in the medium term, which was previously broken resistance. The reaction to support is weakening, while the broader market remains in a bearish trend
Bitcoin remains stagnant and range-bound. Globally, the market remains in a bearish trend, with no fundamental support in sight.
A decline in the market leader could trigger further downside in Ethereum. The altcoin is consolidating within a symmetrical triangle. The market is building a pre-breakdown base near the lower boundary of the current range, suggesting that a downside breakout may be approaching
Resistance levels: 1,989, 1,927
Support levels: 1,866, 1,854, 1,820
The weak reaction to support indicates that selling pressure may be intensifying. I do not rule out a local liquidity sweep (short squeeze) before the downtrend resumes.
A close below the 1,866–1,854 zone could accelerate the further decline
Best regards,
R. Linda  Short
Short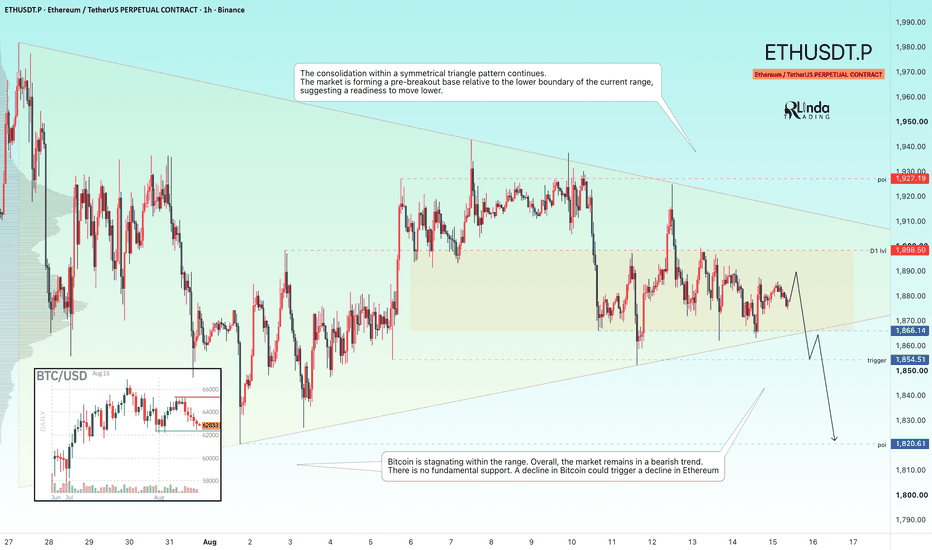
BITCOIN - A false breakout before a declineBINANCE:BTCUSDT.P closed within the 62,000–66,000 range. Liquidity zones have formed around the consolidation boundaries, but buyer weakness could potentially trigger a decline toward the areas of interest
There is no fundamental support in the market, while the geopolitical backdrop is exerting excessive pressure.
Technically, Bitcoin remains stagnant and trapped inside a sideways range that is developing within the broader global bearish trend. Simply put, the market is consolidating.
The reaction to support is weakening. However, before the decline continues, market makers may trigger a short squeeze toward the 65K resistance level. The area of interest is the liquidity zone around 62,300
Resistance levels: 64,500, 65,400
Support levels: 62,300, 61,900
A false breakout of the nearest resistance zone could shift the balance of power in favor of sellers and trigger a breakout from the triangle, potentially followed by downward distribution toward 62,000
Best regards,
R. Linda  Short
Short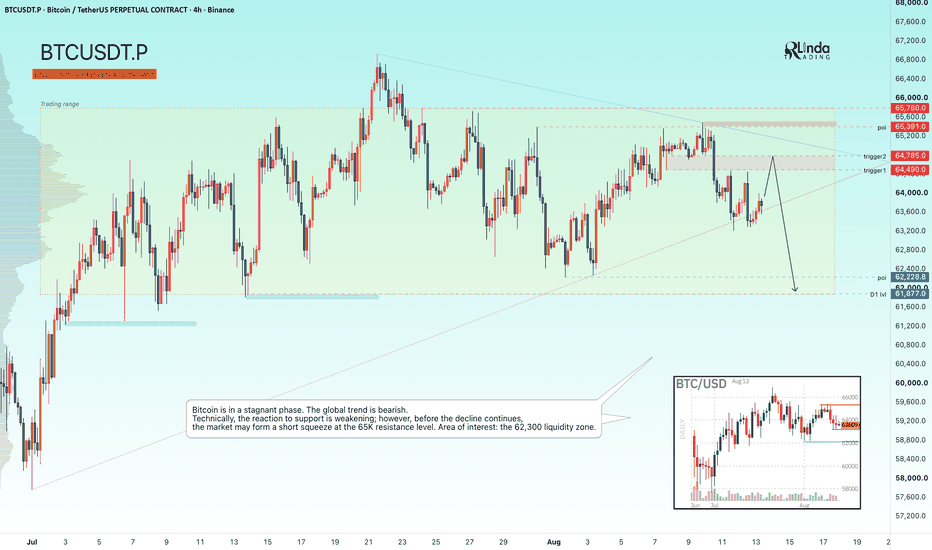
 Short
Short
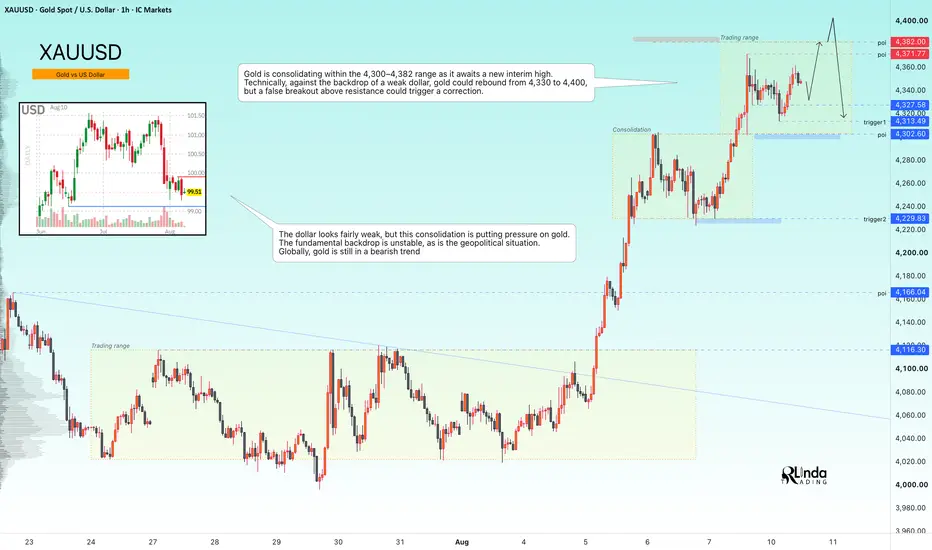
GOLD - Retest of 4400. Waiting for a false breakout ICMARKETS:XAUUSD is showing local bullish momentum, but price is approaching a major resistance zone at 4382–4400. At the same time, the U.S. dollar remains weak, although its current consolidation continues to create pressure across the markets
The fundamental backdrop remains unstable. Geopolitical risks continue to support the dollar, while expectations for further Fed rate hikes have weakened. Against this mixed backdrop, gold remains within a broader bearish trend.
Gold is consolidating inside the 4300–4382 range while preparing for a potential retest of the recent high. Technically, continued dollar weakness could allow gold to rebound from 4330 toward 4400. However, profit-taking around 4380–4400, followed by a false breakout, could trigger a reversal.
Bullish drivers: Weaker-than-expected inflation data, Continued U.S. dollar weakness, Lower rate expectations
Bearish drivers: U.S. dollar strengthening, Rising oil prices and inflation expectations, Profit-taking ahead of the CPI report
Resistance levels: 4371, 4382, 4400
Support levels: 4327, 4313, 4302
A short squeeze through the resistance zone followed by a bearish reversal pattern could trigger a pullback or even reverse the current local bullish momentum.
However, an unexpected fundamental catalyst or a sustained close above 4400 could invalidate the bearish setup and open the way toward 4450–4475.
Best regards,
R. Linda Short 
GOLD - A short squeeze could lead to a correction ICMARKETS:XAUUSD is advancing during the Asian session as part of a distribution phase, testing the 4166–4195 resistance zone. The move is being driven by Western comments regarding negotiations in the Middle East. However, Iran has yet to respond, leaving geopolitical uncertainty elevated.
The U.S. dollar remains in consolidation following last week's decline, which was largely triggered by intervention in the Japanese yen. Gold showed little reaction to the weaker dollar and continued trading sideways. Today's rally is primarily geopolitically driven, but the backdrop remains fragile because the market has only heard one side of the story. Any unexpected development could quickly reverse the move.
At the same time, the Federal Reserve's hawkish stance and uncertainty surrounding the negotiations may continue to limit upside potential. The sustainability of the current recovery will depend on developments in the Strait of Hormuz and upcoming U.S. labor market data.
Resistance levels: 4166, 4195
Support levels: 4130, 4116
From a technical perspective, gold has broken above 4166, but buyers have so far been unable to build on the breakout. A false breakout from this resistance zone could trigger a corrective move under the pressure of the broader bearish trend. The 4195 level also remains a key liquidity zone. A short squeeze into either resistance area could provide the catalyst for a decline toward 4130–4110.
Best regards,
R. Linda Short 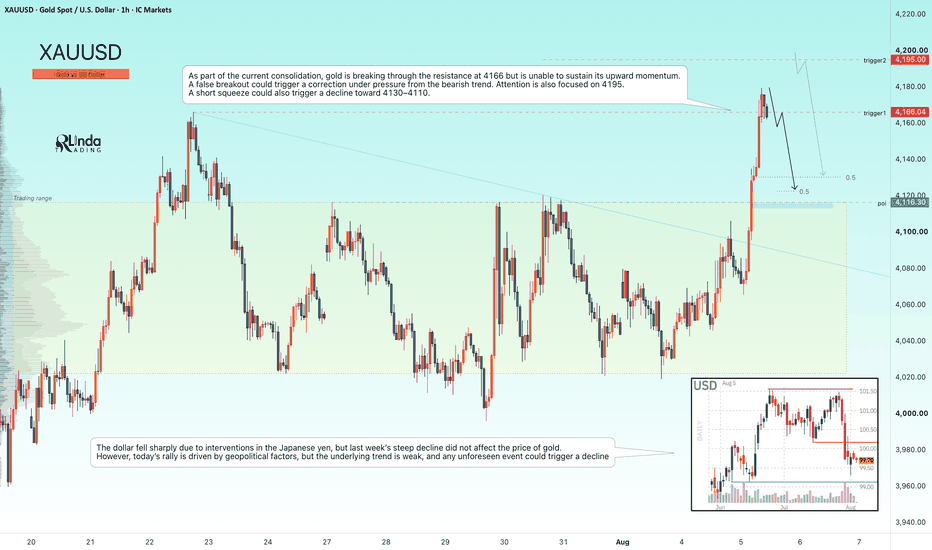
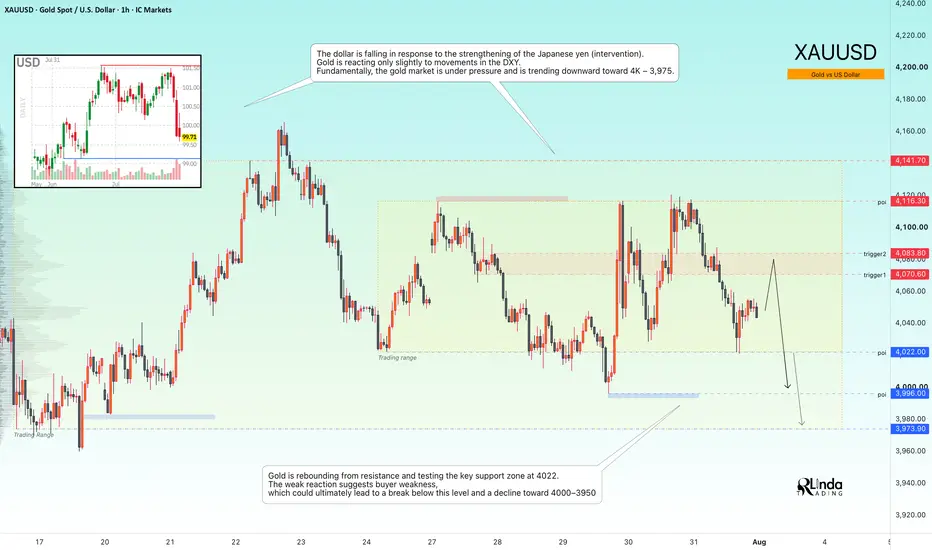
GOLD - Consolidation Amid a Bearish Trend ICMARKETS:XAUUSD remains trapped within the 4022–4116 trading range as markets await the next major economic catalysts. From a technical perspective, however, the broader bearish trend continues to dominate
The U.S. dollar has weakened following renewed strength in the Japanese yen, driven by intervention efforts. Despite this, gold has shown only a muted response to the decline in the DXY. Fundamentally, the metal remains under pressure, with the market still favoring a move toward the 4000–3975 area.
The fundamental backdrop remains challenging for gold. The Federal Reserve is facing an unusually deep policy divide, with three members favoring another rate hike, uncertainty surrounding Governor Waller's outlook, weaker U.S. macroeconomic data (GDP at 1.5%, PCE easing to 3.3%), and renewed geopolitical tensions in the Middle East. Higher oil prices continue to reinforce inflation concerns and support a more hawkish Fed outlook.
Technically, gold has rejected resistance and is now testing the key 4022 support level. The weak buying response suggests limited bullish momentum, increasing the probability of a downside breakout toward 4000–3950
Resistance levels: 4070, 4083, 4116
Support levels: 4022, 3996, 3973
Before the broader decline resumes, the market may first retest the 4070–4083 resistance zone from the session open. The 4116 level also remains a key area to watch. A short squeeze into these resistance levels could provide the catalyst for another bearish reversal toward 4000.
Best regards,
R. Linda GOLD - The bearish trend continuesICMARKETS:XAUUSD remains in a medium-term bearish trend. The recent attempt to break above 4116 failed, and the market has once again transitioned into a selling phase
Gold is currently caught between geopolitical tensions, which tend to strengthen the U.S. dollar, and expectations surrounding upcoming central bank decisions. The next directional move will largely depend on developments in the Middle East and signals from the Bank of Japan. A continued hawkish stance from the Federal Reserve and a stronger dollar are likely to keep gold under pressure, while a weaker dollar and geopolitical de-escalation could support a recovery.
Bullish drivers: Geopolitical de-escalation, U.S. dollar weakness, A less aggressive Bank of Japan, Weaker-than-expected U.S. economic data
Bearish drivers: Escalation of geopolitical tensions (supporting the U.S. dollar), Renewed strength in oil prices, Strong U.S. macroeconomic data, Hawkish Federal Reserve rhetoric
Resistance levels: 4070, 4083, 4116
Support levels: 4028, 3995
The sharp decline in the U.S. dollar was largely a reaction to the Fed meeting and its mixed communication. However, the broader policy stance remains hawkish, supporting the longer-term bullish trend in the dollar and maintaining bearish pressure on gold.
Bears have successfully defended both 4116 and 4083, while price is now consolidating below 4083. Sustained trading beneath this level could provide the technical catalyst for another leg lower
Best regards,
R. Linda Short 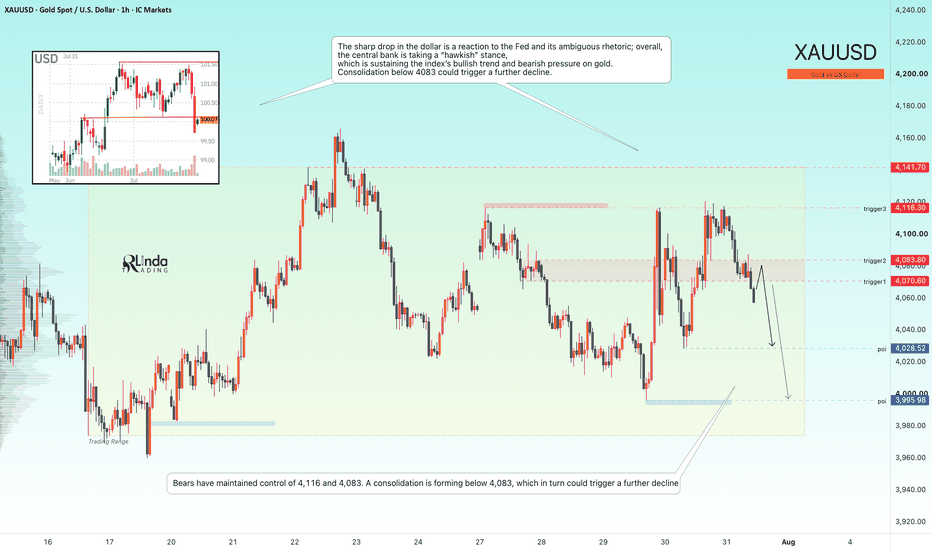
Short