#IDUSDT Medium-term Bullish potential !#ID
The price is moving within a descending channel on the 1-hour timeframe and has reached the lower boundary. It is now poised for a bounce and is expected to retest this boundary.
The Relative Strength Index (RSI) indicates a downward trend, which is likely to continue given the overbought conditions.
There is a key support zone in green at 0.0221. The price has bounced off this zone several times, making it a strong support level.
The price is trending towards the 100-period moving average, which we are approaching. This trend supports an upward move.
Entry Price: 0.0288
Target 1: 0.0300
Target 2: 0.0322
Target 3: 0.0345
Stop Loss: At the resistance zone in green
Remember this simple rule: Money management.
Any questions? Please leave a comment.
Thank you.
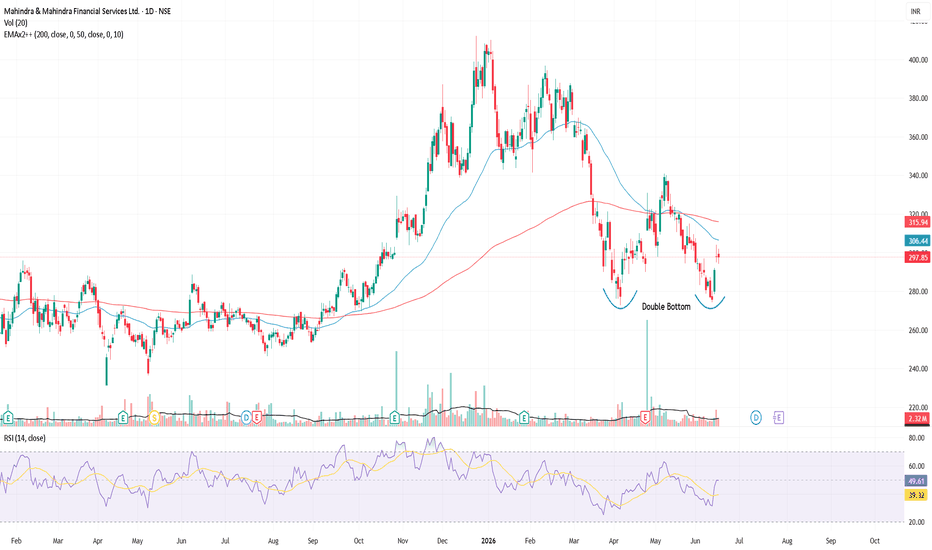
Double Bottom
M&M Financial Services – Attempting a Trend Reversal?🔹 **Trend:** Recovery phase after taking support near the 270 zone.
🔹 **Support Zone:** 270 – 280
🔹 **Resistance Zones:**
• 340 (previous swing resistance)
🔹**50 EMA:** ~315
🔹 **200 EMA:** ~306
🔹 **Volume:** Improved participation visible during the recent bounce.
🔹 **Price Structure:** Potential double-bottom formation around the 270 area.
🔹 **Momentum:** RSI has recovered from lower levels and is moving higher, indicating improving strength.
🔹 **What to Watch:**
• Sustaining above the 200 EMA.
• A move above the 50 EMA could further strengthen the trend.
• Holding above the 270–280 support zone remains crucial.
📊 Overall, the stock appears to be transitioning from a corrective phase into a recovery phase, with key moving averages acting as immediate hurdles.
Disclaimer - This for educational purpose only. take advice from your financial advisor before investing.
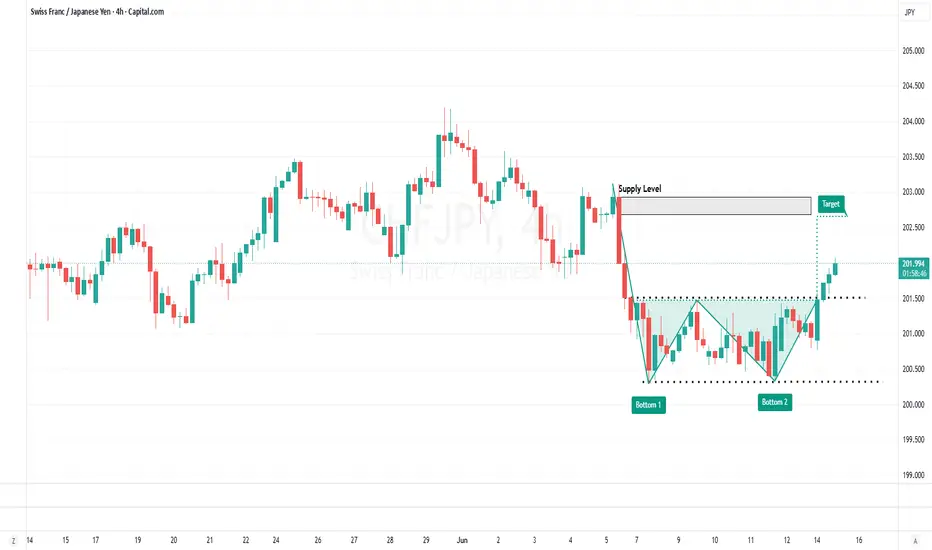
CHFJPY, 4H Double Bottom Set Up
CHFJPY has broken out of a consolidation range on the 4H timeframe, signalling growing bullish momentum. The move is further supported by a Double Bottom pattern, with price now breaking above the neckline confirmation level.
With buyers in control, a BUY setup remains valid, targeting the next key supply zone as TP1. Traders should monitor price action for continued strength above the breakout area.
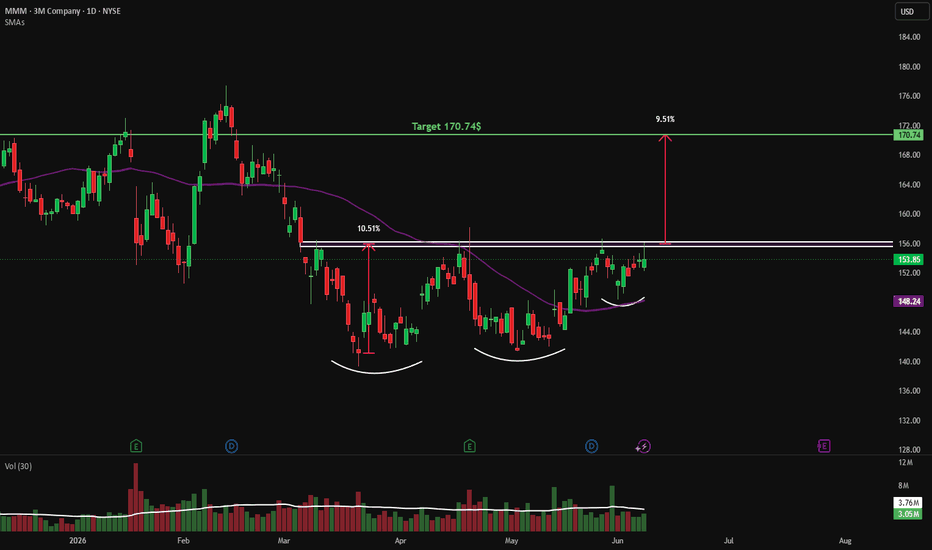
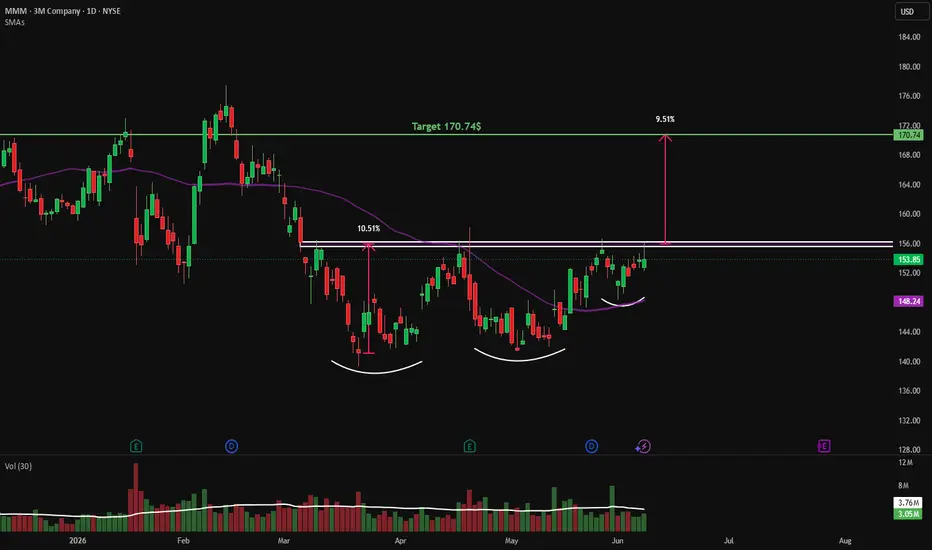
$MMM - 50 SMA Cross and Potential Double Bottom Breakout💡 Swing setup idea
Potential bullish breakout
🔎 Analysis summary:
The stock crossed above the 50 SMA and is currently setting up for a double bottom breakout.
Rising buyers volume is supporting the move and adding strength to the setup as it approaches the trigger level.
👀 Levels to watch:
Entry trigger: Break above $156.21
Target: $170.74
Stop: Under the breakout level
💬 What do you think of this setup? Let me know in the comments! 👇
Good luck!
⚠️ Note: This is for educational purposes only and is not financial advice.
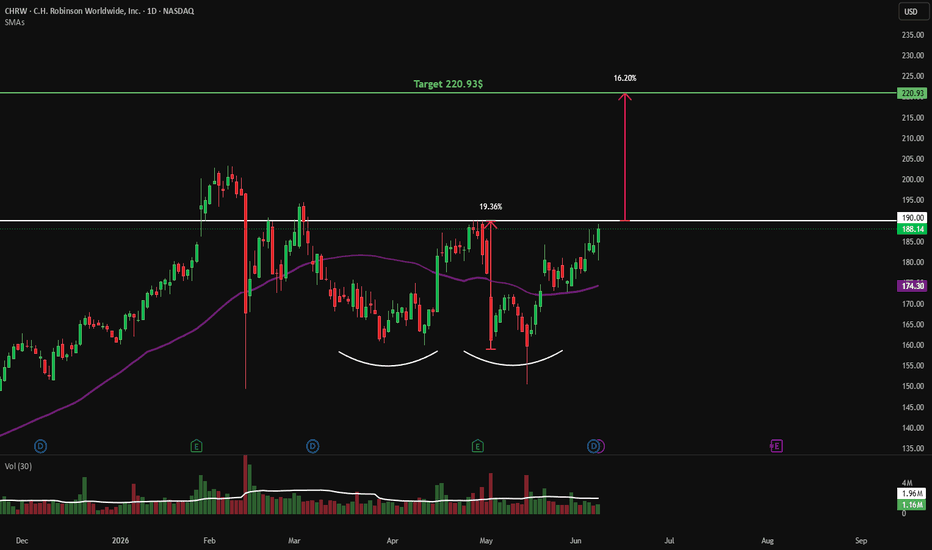
$CHRW - Double Bottom and 50 SMA Breakout💡 Swing setup idea
50 SMA breakout
🔎 Analysis summary:
The stock successfully broke above the 50 SMA and closed a classic double bottom pattern.
👀 Levels to watch:
Entry trigger: Break above $190.00
Target: $220.93
Stop: Under the breakout level
💬 What do you think of this setup? Let me know in the comments! 👇
Good luck!
⚠️ Note: This is for educational purposes only and is not financial advice.
Missed the Double Bottom at Key Structure? Wait for This NextIn today’s video, I’m following up on one of our trading ideas from this weekend’s Trading Edge where we analyzed GBP/USD as it pulled back into a key level of structure.
After a strong momentum sell-off to close out last week, price reacted bullishly right at a previously tested support zone, forming a classic double bottom pattern. This is a great example of how price action tends to repeat at important structural levels.
We’ll break down:
A secondary entry opportunity for traders who missed the first signal
And most importantly, how broader market context determines whether a setup is still valid or should be avoided
This video is also a reminder that no single pattern should ever be traded in isolation. The real edge comes from combining structure, momentum, and overall market analysis to decide if a trade is actually worth taking.
Please leave any questions, comments or trading ideas below.
Akil
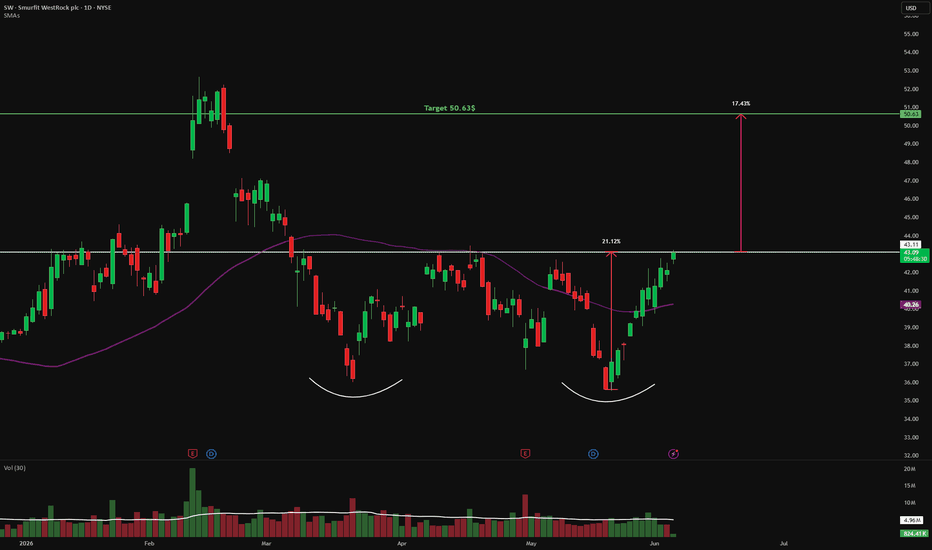
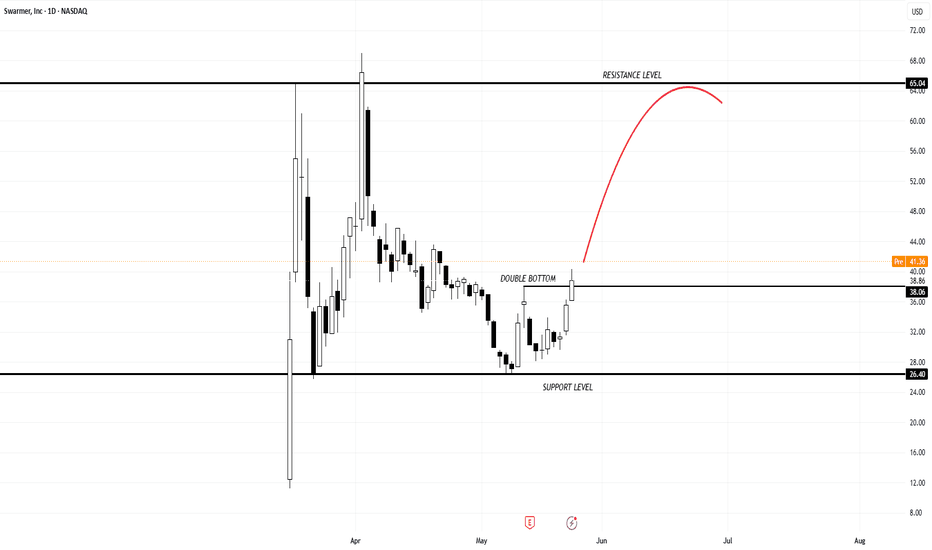
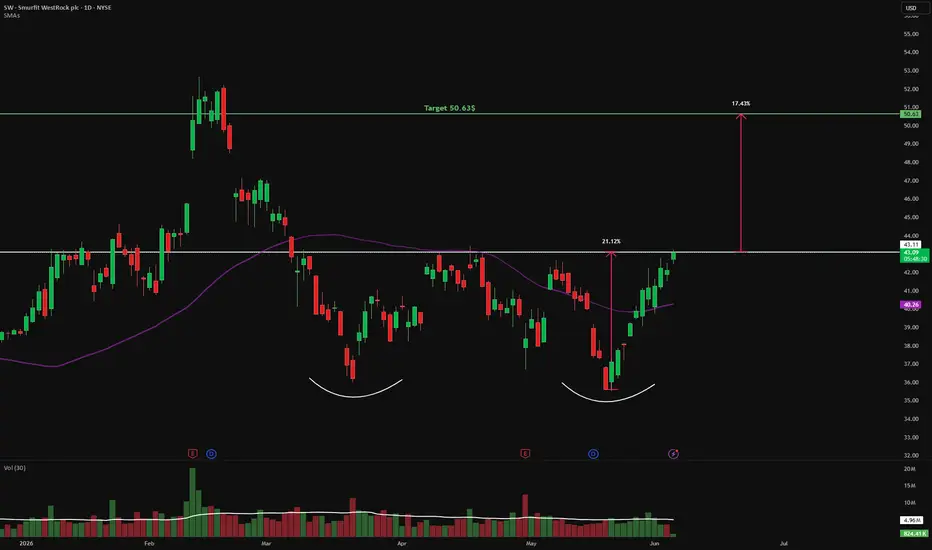
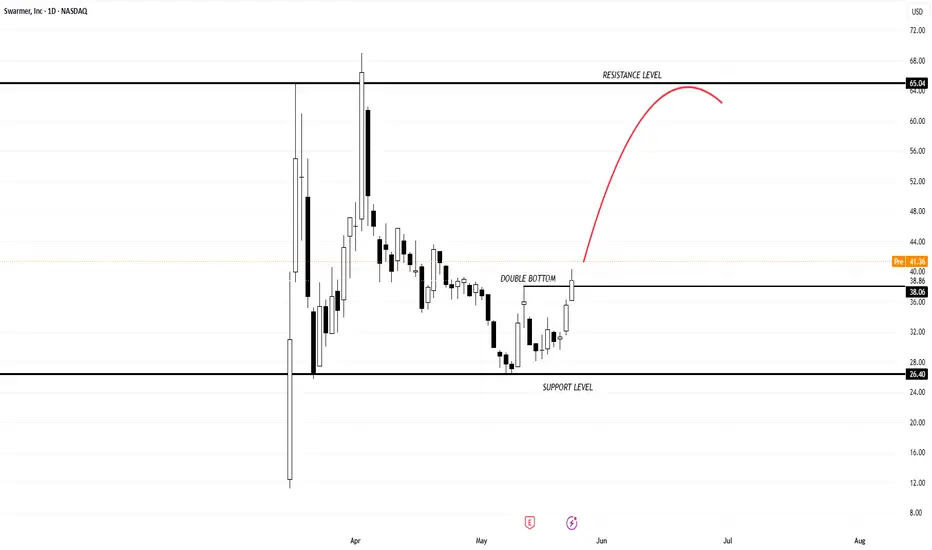
$SW - Classic Double Bottom and 50 SMA Breakout💡 Swing setup idea
Bullish breakout / Watchlist setup
🔎 Analysis summary:
The stock crossed the 50 SMA, closing a classic double bottom pattern.
Right now, the volume is not rising significantly, so this is a great setup to add to the watchlist and monitor for more buying pressure to step in.
🔔 Friendly reminder: The S&P 500 is currently trending down, so please keep the broader market weakness in mind before entering any new trades.
👀 Levels to watch:
Entry trigger: Break above $43.11
Target: $50.63
Stop: Under the breakout level
💬 What do you think of this setup? Let me know in the comments! 👇
Good luck!
⚠️ Note: This is for educational purposes only and is not financial advice.
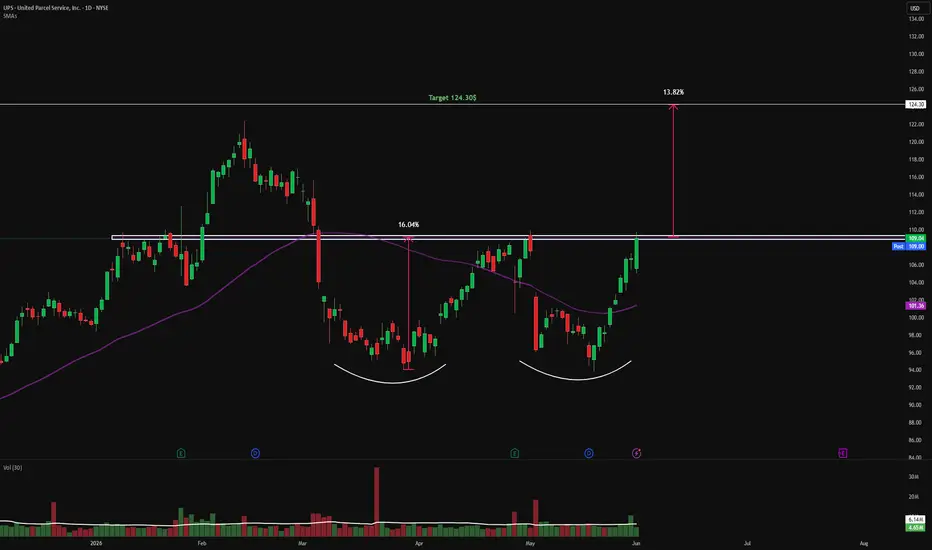
$UPS - Double Bottom and 50 SMA BreakoutSwing setup idea
50 SMA Bullish reversal
Analysis summary:
The stock just closed a double bottom pattern and crossed back above the 50 SMA.
Strong buying volume is stepping in, showing solid conviction at this level.
Levels to watch:
Entry trigger: Close above $109.31
Target: $124.30
Stop: Below support
Good luck!
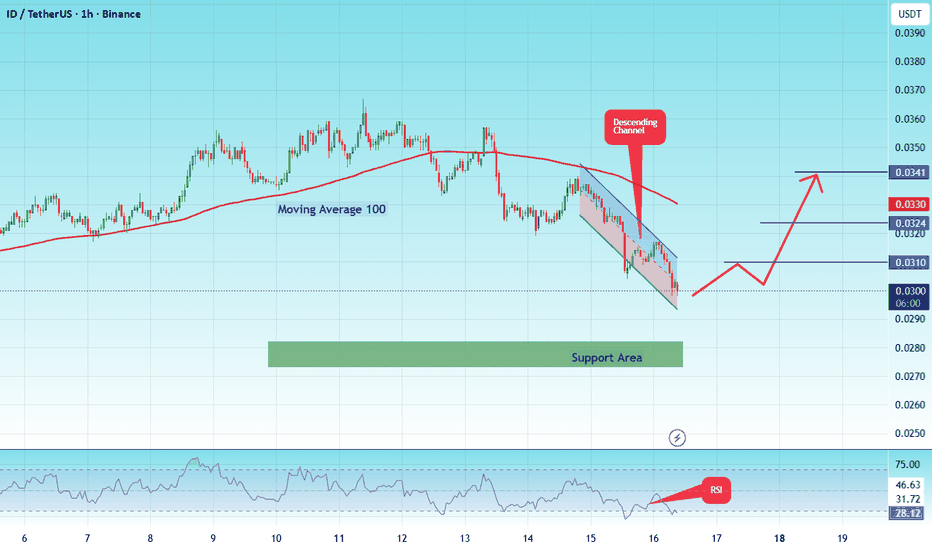
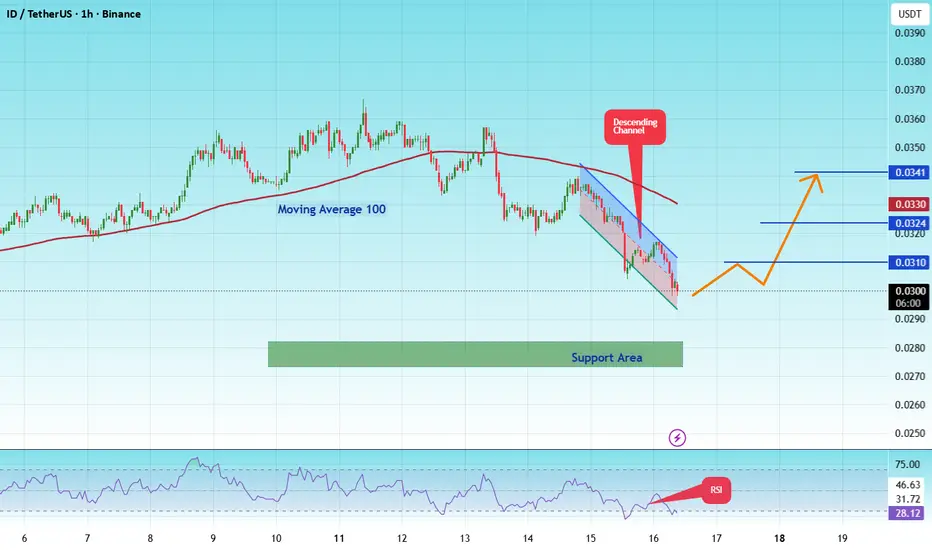
#IDUSDT Medium-term Bullish potential !#ID
The price is moving within a descending channel on the hourly timeframe. It has reached the lower boundary and is trending towards a bounce. A retest of this boundary is expected.
The Relative Strength Index (RSI) indicates a downward trend, and this trend is likely to continue due to the overbought condition.
A key support zone has been identified in green at 0.0270. The price has bounced off this zone several times, making it a strong support level.
The price is trending towards the 100-period moving average, which we are approaching. This trend supports an upward move.
Entry Price: 0.0300
First Target: 0.0310
Second Target: 0.0324
Third Target: 0.0341
You can close at the second target or wait for the third target to be reached. The choice is yours.
Stop Loss: At the resistance zone in green.
Remember this simple rule: Money Management.
Any questions? Please leave a comment.
Thank you.
CADJPY Double Bottom Set Up
On the 4-hour timeframe, CADJPY has formed a well-defined Double Bottom pattern, a classic bullish reversal formation that often signals the end of a downtrend and the beginning of a potential upward move. The pattern is characterised by two consecutive lows occurring at a similar price level, indicating that sellers have attempted to push the market lower on multiple occasions but have failed to establish new lows.
The neckline of the pattern, formed by the swing high between the two bottoms, represents a key resistance level that traders closely monitor. CADJPY has now broken above this neckline, providing confirmation of the Double Bottom formation and suggesting that bullish momentum is gaining strength. This breakout indicates that buyers have successfully taken control of the market and may continue to drive prices higher in the coming sessions.
The breakout is particularly significant because it confirms the completion of the reversal pattern. In many cases, the neckline that was previously acting as resistance may now serve as a support level, strengthening the bullish outlook. Traders often view such breakouts as favourable opportunities to enter long positions, especially when accompanied by increasing momentum and strong price action.
Based on the current technical structure, further upside is expected as the market continues to build on the bullish breakout. The first profit target (TP1) is positioned at the next significant resistance level of 116.00 , where price may encounter selling pressure. Traders may consider securing partial profits at this level or adjusting risk management parameters to protect gains as the trade progresses.
While the technical outlook remains positive, traders should continue to monitor price action around the breakout area. Maintaining support above the neckline would reinforce the bullish scenario and increase the likelihood of CADJPY reaching its target at 116.00.
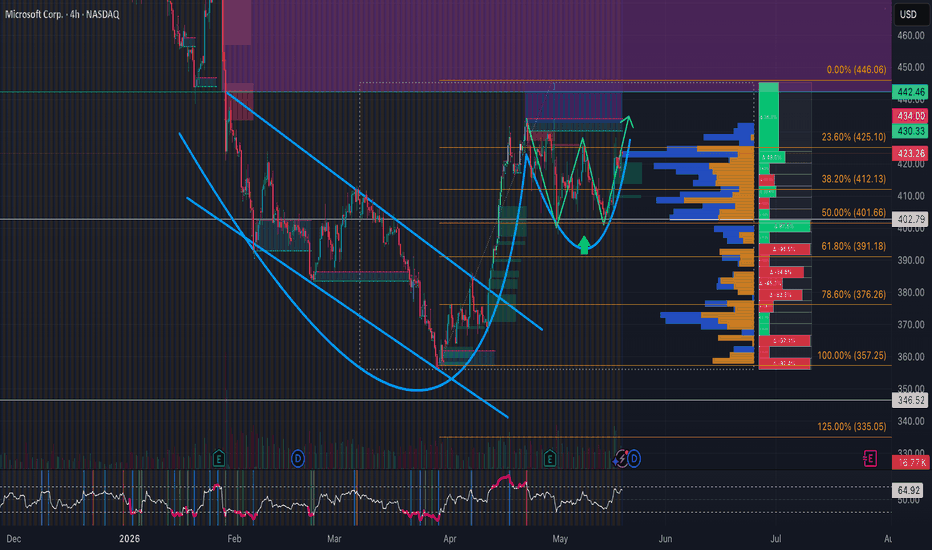
MSFT Forming a Big Cup and Handle after Falling Wedge BreakoutNASDAQ:MSFT finally broke out of the falling wedge it's been holding for ages and is forming a pretty clean cup and handle. NASDAQ:MSFT retraced and bounced cleanly off the 50% FIB mark, forming a nice double bottom or W pattern as well.
EMA's are curling upwards, as long as volume holds, Trump doesn't backtrack on Iran, and of course broader market conditions hold- NASDAQ:MSFT could really breakout to the upside and go for the gap fill at $442.46.
PT1- $432.50
PT2- $437.70
PT3- $442.60+ Gap Fill on the Upside
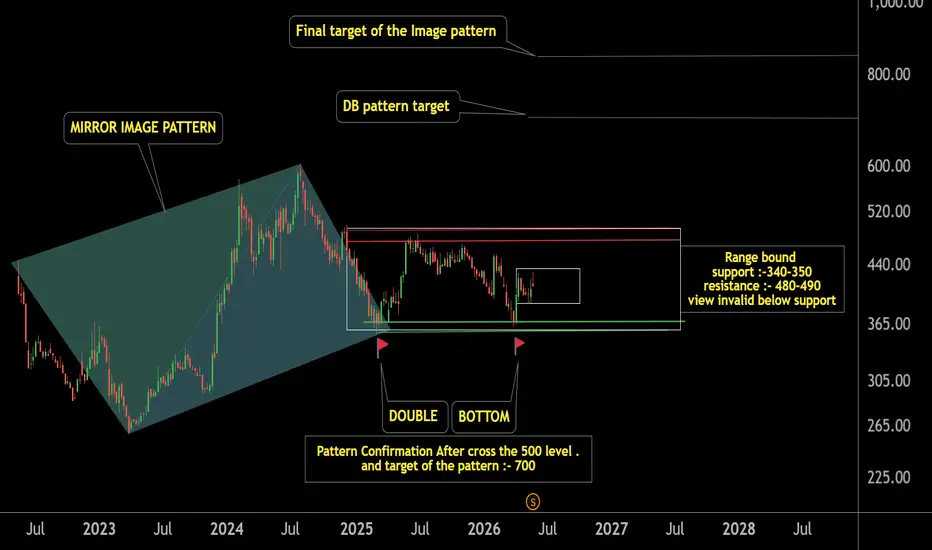
LICI: Double Bottom + Mirror Image Pattern – Big Move LoadingThe stock has formed a strong Mirror Image Pattern along with a Double Bottom formation, indicating a potential trend reversal after a prolonged correction phase.
The support zone around 340–350 has been tested multiple times and has shown strong buying interest, strengthening the bullish structure.
A sustained move above the key resistance zone of 480–500 would confirm the pattern and could trigger a significant upside move towards 700 and higher levels.
Bullish view remains intact as long as the support zone holds.
View invalid below the support zone.
Thank You !!
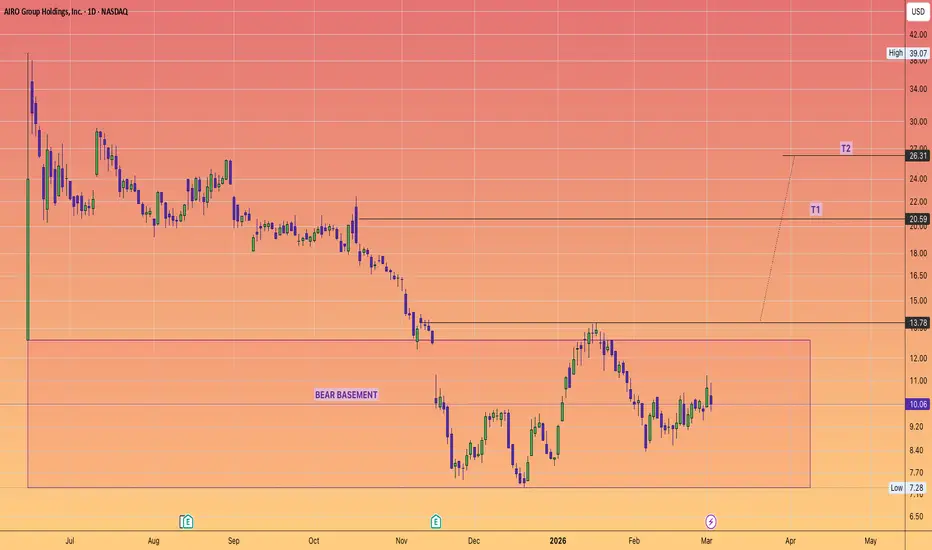
$AIRO Group: Bottom-Building in the Bear BasementAfter the IPO high of$39.07, the stock has spent recent months establishing a support floor within the highlighted "Bear Basement" zone, primarily between $7.28 and $13.78.
Recent price action suggests a potential double-bottom formation near the $10.06 level, a common technical signal for an impending trend reversal as buyers begin to show aggression.
Looking ahead, a decisive breakout above the current consolidation range could trigger a move toward the first target (T1) at $20.59, aligning closely with the current Wall Street average price target of $19.67.
A successful breach of this level could pave the way for a secondary target (T2) at $26.31. This bullish outlook is supported by recent fundamental catalysts, including a $1.9 million U.S. Navy contract and a robust $190 million backlog in the high-growth drone and defense segments.
The #Drone sector obviously will only get bigger in the years ahead.
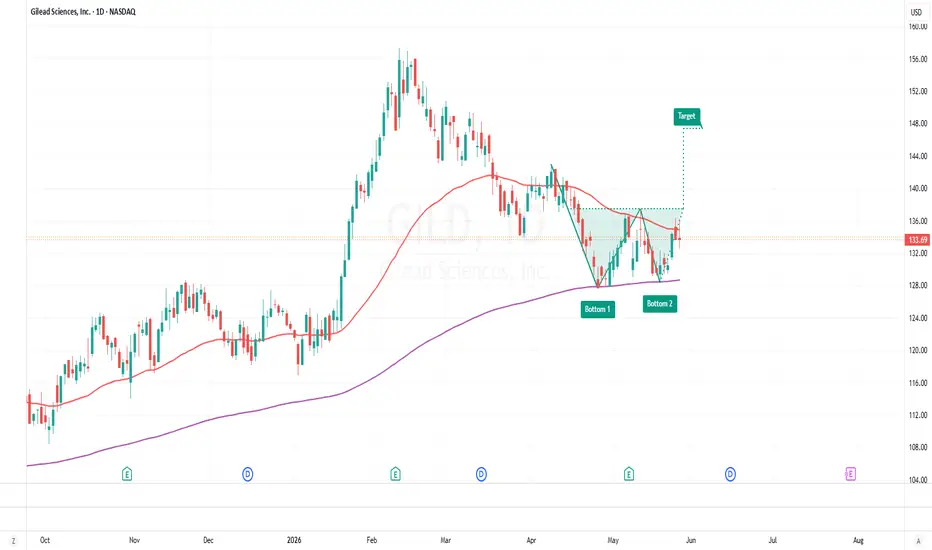
$GILD double bottom set up
GILD Fundamental Analysis
Gilead Sciences has demonstrated resilient core performance driven by its HIV and antiviral franchises, with Q1 2026 revenue of approximately $6.96 billion, up about 4 % year-over-year, and net income expanding over 50 % versus the prior year on EPS of $1.61 (diluted) – outperforming consensus expectations. The company also raised full-year 2026 product sales guidance to about $30–30.4 billion, supported by strong demand for its HIV portfolio and growth in key therapies such as Biktarvy and Descovy. However, earnings guidance was revised lower due to substantial acquisition-related charges, which are expected to pressure profitability in the near term. Overall, fundamentals reflect solid revenue growth and profitability metrics, supported by product leadership and an attractive dividend yield, balanced against transitional cost headwinds and integration risk.
Technical Analysis
Technically, GILD has formed a double bottom pattern near key support levels, suggesting a potential base and bullish reversal structure on the daily chart. Price action is also respecting the 200 EMA as a strong support level, reinforcing the long-term uptrend and providing structural confirmation for a potential continuation higher.
Trade Setup
Based on this technical framework, an entry on bullish confirmation (e.g., breakout above the interim neckline of the double bottom) can be considered.
Take-Profit 1 (TP1): Next defined resistance zone around recent swing highs/congestion levels.
Risk Management
A disciplined stop-loss/ hedge stop should be placed below the pattern’s support to manage downside risk, with position sizing aligned to broader portfolio risk tolerance.
Note: This is a structured market observation and not personalised financial advice; always conduct your own due diligence.
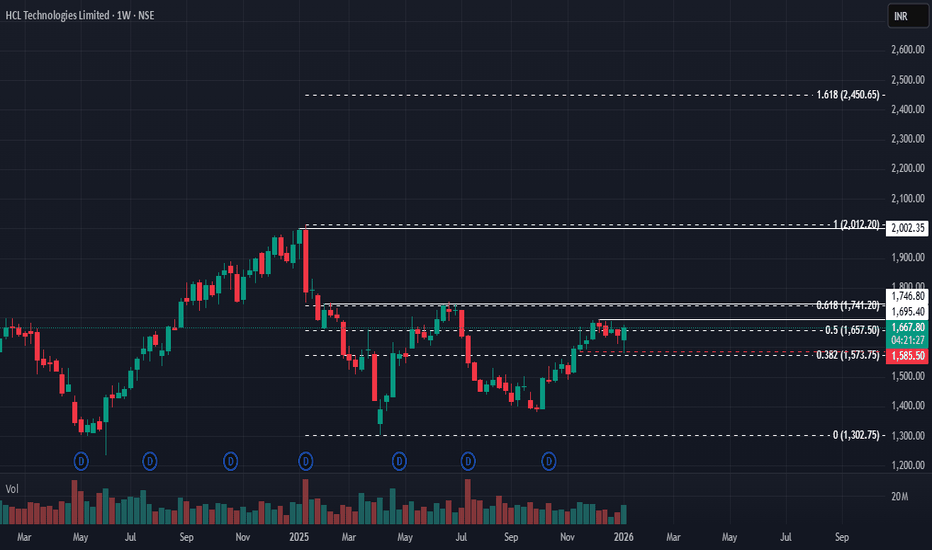
HCL Technologies — 61.8% Fib Breakout Setup💻 HCL Technologies — 61.8% Fib Breakout Setup
CMP: ₹1,668
Stop Loss: ₹1,580
Targets: ₹1,747 / ₹2,002
🔍 Price Action View
Amid ongoing tariff-related news flow and elevated volatility, HCL Tech is emerging as one of the stronger names within the IT pack.
Key technical highlights:
Formation of a clear double bottom structure
₹1,747 is the critical level — it marks both the neckline of the pattern and the 61.8% Fibonacci retracement
A decisive breakout above ₹1,747 can trigger fast upside expansion, with momentum carrying the stock towards the ₹2,002 zone
This is a break-with-force setup — follow-through strength above 1,747 will be the confirmation.
⚠️ Risk & Execution Note
With high volatility in global markets, risk management becomes more important than prediction.
⚠️ Trading Approach
This is a patience trade, not a momentum chase
Reduce position sizing due to volatility
Let the price structure confirm and expand
Avoid over-leveraging; give the setup enough room
⚠️ Clarification:
This is an independent analysis based purely on technical and market study. No part of Religare is involved in this view or recommendation.
📝 Important:
I am not responsible for any loss or profit incurred. I am not taking any fees for these views – just sharing my analysis for educational and informational purposes.
📉 Disclaimer:
Not SEBI-registered. Please do your own research or consult a financial advisor before taking any investment decision.