National Industrialization (2060) : Resistance Ahed !!TADAWUL:2060
🚀 10 SAR: The Breakout Level That Could Unlock 12 → 15 → 20
The stock is approaching a critical breakout zone around 10 SAR.
A decisive breakout and sustained move above 10 could signal a shift in momentum and open the path toward the next resistance and profit-taking levels:
🎯 12 → 15 → 20
🔥 Longer-Term Fibonacci Targets
If the bullish structure remains intact and momentum continues to expand, the Fibonacci extension levels point toward potentially larger objectives:
🚀 27
Fibonacci Extension
SPCX: Bearish Sequence Unfolding Toward Downside Target CFollowing the completion of the prior bullish sequence into the overhead target zone near 150.00, NASDAQ:SPCX has shifted market structure to begin a corrective phase. Price action has formed a clear bearish sequence from the highs, defining an initial impulse into Point A followed by a corrective bounce to Point B.
The aggressive breakdown from the upper consolidation confirms active continuation toward the bearish Point C target. This projected target box sits between 125.50 and 129.00, rep
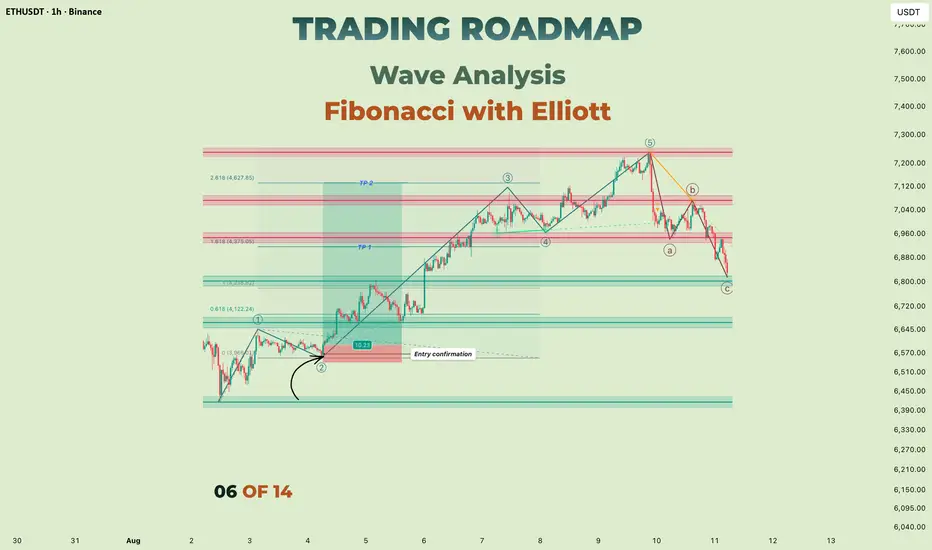
Trading Roadmap| Wave Analysis·Lesson 06— Fibonacci with ElliottLesson 6 - Fibonacci with Elliott
Difficulty: (Intermediate)
Wave counting tells you where you are in the structure. Fibonacci tells you how far the next leg might travel. On their own, each one leaves a gap — a count with no measurement, or a set of levels with no context. Used together, they answer two different questions at the same time.
A completed five-wave advance followed by an A-B-C correction. Before any measurement is added, the count has to survive the rules from Lesson
Ash-Sharqiyah Development : Bulls AliveTADAWUL:6060
🚀 13.4–13.8: Critical Retest Zone — Bulls Still Have a Chance
The stock is now sitting on a key technical confluence zone between 13.40–13.80.
This area combines two important signals:
📌 0.618 Fibonacci retracement support
📌 Trendline breakout–retest confirmation
As long as price sustains this zone, the bullish structure remains alive and buyers have a chance to push the stock toward:
🎯 17.00
🎯 19.44
🎯 22.00
📊 Key Levels
🛡️ 13.40–13.80: Critical support & breakout-retest z
Al Munajem Foods : Slow & SteadyTADAWUL:4162
📈 Slow & Steady Climb Toward a Weekly Breakout — Is the Next Major Rally Approaching? 🇸🇦
The weekly chart continues to paint a constructive bullish picture, with price steadily advancing toward a major breakout zone. Unlike explosive rallies, this gradual ascent reflects healthy accumulation, often laying the groundwork for a stronger and more sustainable uptrend.
The key now is confirmation above resistance.
🔍 Technical Outlook
The 67 price level is the most important resist
Price Confirms Further Extension After Reversal Pattern FormsOANDA:EURUSD on the Daily chart is getting ready to complete a favorable Confirmation Candlestick Pattern called the Three Inside Up at the 1 Fibonacci Extension Level and could be eyeing to head further!
- Last week ended with a Breakout of Previous Highs on Thursday, followed by an abrupt Retest on Friday.
- This week started with price making a decline back to the 1 Fibonacci Extension Level but found Support through Tuesday to where we can see price now is attempting another Breakout of
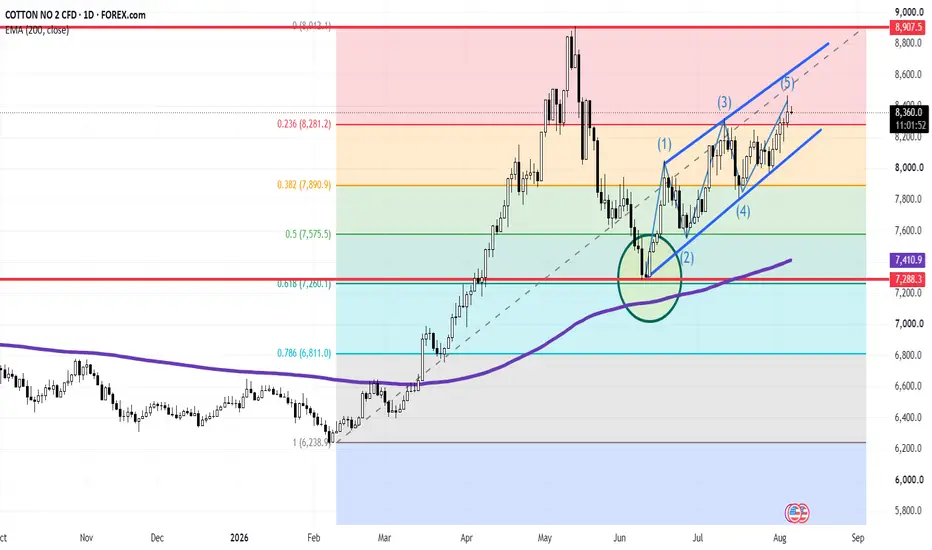
Cotton No. 2 ($COTTON) Daily: 5-Wave ElliottCotton No. 2 ( PEPPERSTONE:COTTON ) Daily: 5-Wave Elliott Impulse Advances Towards 8,907 Macro Ceiling Following 0.618 Fibo Rebound
### 🌾 Cotton No. 2 CFD ( PEPPERSTONE:COTTON ) Daily Technical Matrix (Ref: COTTON_2026-08-06_08-56-13.png)
We are releasing a Daily (1D) Elliott Wave structural framework on Cotton No. 2 ( PEPPERSTONE:COTTON ). Following a clean technical reaction off key multi-confluence support inside the highlighted green circle, price action has been executing a textbook 5-wave
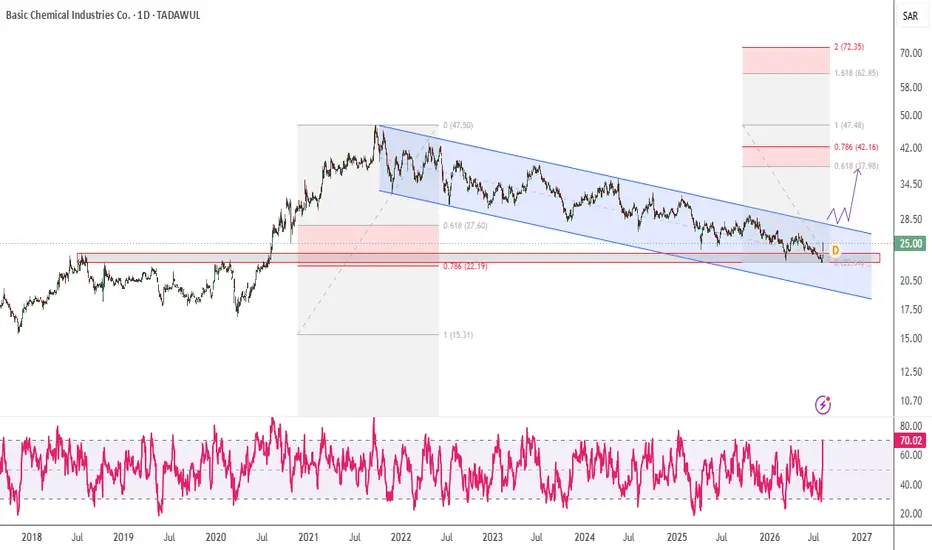
Basic Chemical : Triple Confluence for Upside !TADAWUL:1210
📈 Descending Channel Meets Triple Confluence — Is a Bullish Reversal Brewing? 🇸🇦
The stock continues to trade within a well-defined descending parallel channel, but several technical signals suggest that selling pressure may be fading and a reversal could be taking shape.
With multiple bullish confluences aligning, this is a setup worth keeping on your watchlist.
🔍 Why This Setup Stands Out
📌 1. Descending Parallel Channel
Price remains confined within a descending channel, w
AMZN – Repair Trigger Reclaimed, Add Watch Eligible | CSE OptionAmazon is currently one of the strongest live continuation cases inside my CSE Capital — Option Decision OS, also known as the Continuation Swing Engine.
The current CSE read is very clear: the underlying thesis is intact, the trend is bullish, and the tactical repair trigger has been reclaimed. This is an important shift, because AMZN is no longer in a “wait for repair” state. The stock has already moved above the key repair area and is now trading above the main CSE entry zones.
At the time
NVDA – Thesis Intact, 211 Reclaim Required | CSE Option DecisionNVIDIA remains one of the most important live momentum cases inside my CSE Capital — Option Decision OS, also known as the Continuation Swing Engine.
The current CSE read is very clear: the underlying thesis is still intact, the trend remains bullish, but the system does not classify this as a clean add setup yet. Instead, NVDA is currently in a Hold / Profit Review state with a reclaim watch around the 211 area.
At the time of this CSE snapshot, the provider price is around 207.91. That place
Thob Al-Aseel : Breakout for Upside RallyTADAWUL:4012
🚀 Trendline Breakout Loading? A Sustained Move Above 4 SAR Could Trigger Strong Upside 🇸🇦
The stock is showing encouraging signs of recovery after bouncing from a high-probability Fibonacci demand zone, and it's now approaching a critical trendline resistance that could define the next major move.
This is a setup where confirmation—not anticipation—can offer the best risk-to-reward opportunity.
🔍 Technical Outlook
The recent rebound originated from 3.11 SAR, which coincides w
Saudi Darb Investment : the Start of a Multi-Bagger Move? 🇸🇦TADAWUL:4130
🚀 Weekly Reversal at 2.50: Is This the Start of a Multi-Bagger Move? 🇸🇦
The stock is approaching a major weekly reversal zone around 2.50, a level that could determine the beginning of its next long-term trend.
After spending a prolonged period in accumulation, price is now testing a critical resistance where confirmation—not anticipation—should guide trading decisions.
🔍 Technical Outlook
The 2.50 level is the first major hurdle for the bulls.
A decisive breakout, followed
SOL/USDT: Bearish Trend Alignment | Target Levels & Key Buy ZoneSolana (SOL) remains under persistent selling pressure on the daily timeframe. Price action continues to trade well below the 200 EMA, making a series of lower highs and lower lows. A short-term bearish wave is currently active, pointing toward key liquidity/support zones below.
Technical Breakdown
Macro Trend & 200 EMA Resistance:
Price is trading significantly below the 200 EMA (white line), confirming that the overall macro bias remains firmly bearish. Any upward retracements continue to
Amazon ($AMZN) 4H: Breakdown Below 200-EMAAmazon ( NASDAQ:AMZN ) 4H: Breakdown Below 200-EMA & Triangle Support Triggers Slide Toward $208.58 Fibonacci Target
### 🇺🇸 Amazon.com, Inc. ( NASDAQ:AMZN ) 4-Hour Technical Matrix (Ref: AMZN_2026-07-30_08-35-03.jpg)
We are deploying a 4-Hour (4H) structural breakdown framework on Amazon.com, Inc. ( NASDAQ:AMZN / NASDAQ). Following a prolonged period of consolidation within a contracting wedge structure, price action has decisively breached its dynamic baseline and key structural trendline sup
XAUUSD: Wave 5 Sell Setup Targets 3,993
Gold is still trading under bearish pressure after breaking below the previous uptrend trendline. From Kelly’s view, the current structure suggests that the market may still be moving inside a bearish Elliott Wave sequence, with wave 5 aiming towards the lower Fibonacci target area.
The key idea is simple: gold may rebound slightly first, but as long as price stays below the sell zone and strong liquidity resistance, the downside structure remains active.
⟡ Market structure
The chart shows
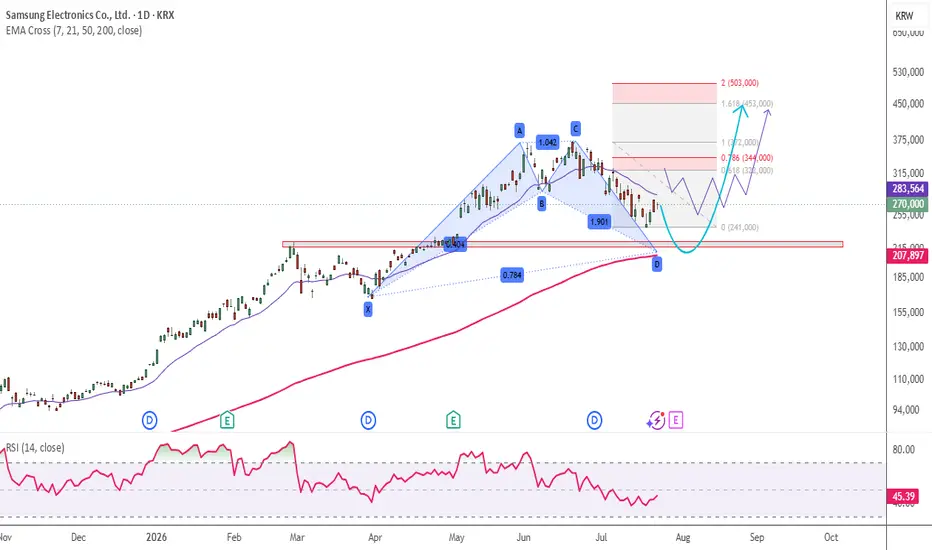
Samsung Electronics : Pullback Before the Next Rally ?KRX:005930 Daily Chart
📈 Key Decision Zone Ahead: Pullback Before the Next Rally? 👀
The stock has staged an impressive recovery after rebounding from the 0.55 Fibonacci retracement zone, confirming strong buying interest from a major technical support area.
However, the next challenge has arrived.
🔍 Technical Outlook
Price is now testing the Daily 20 EMA, which is acting as an immediate resistance level.
A decisive breakout above this dynamic resistance would strengthen the short-term bul
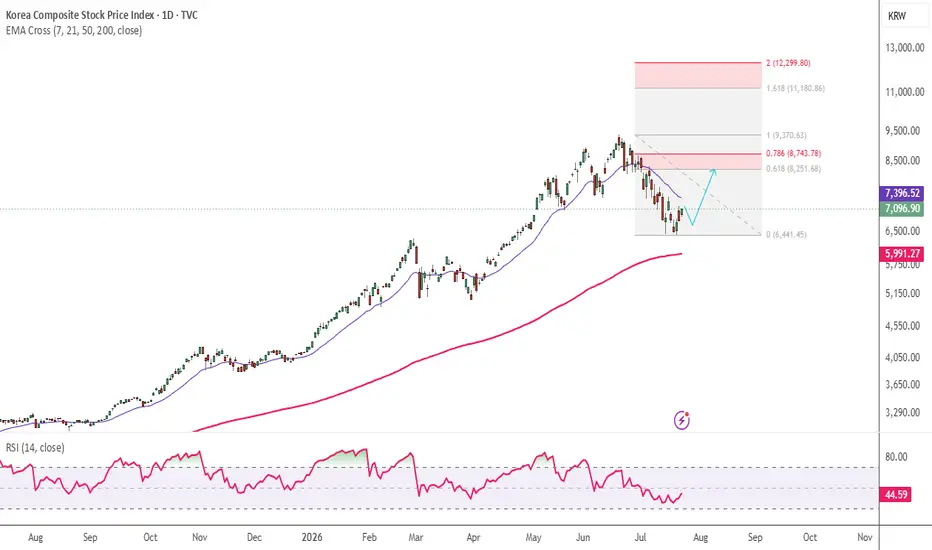
KOSPI : Bull Trap or Continuation Rally ?TVC:KOSPI
📈 Korea's "Talk of the Town" Index at a Critical Inflection Point — Breakout or Bull Trap? 🇰🇷
After forming a convincing double bottom near the 6,440 zone, the index has staged a healthy rebound and is now approaching the 20-day EMA, a key dynamic resistance level that could determine the next major trend.
The coming weeks may define whether this recovery evolves into a sustained uptrend—or proves to be another relief rally.
🔍 Technical Outlook
The recent double-bottom formation
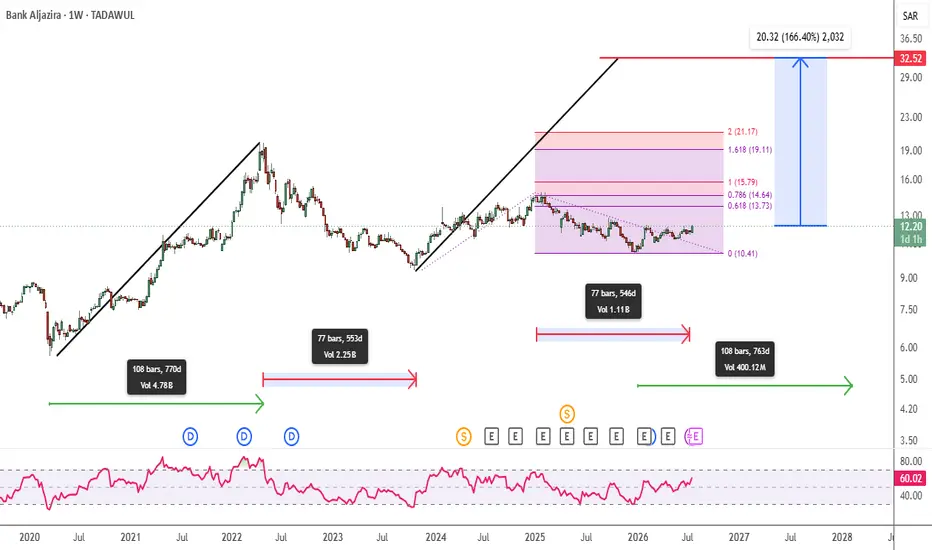
Bank Al Jazira : BUILDING SOMETHING MUCH BIGGER !!TADAWUL:1020
The weekly market structure remains exceptionally strong—and the immediate upside levels are clearly defined:
🎯 14.60
🎯 15.50
🎯 19.11
But zoom out… and the bigger picture becomes even more interesting. 👀
The broader structure appears to be developing into a major AB=CD harmonic pattern.
If the pattern completes as projected, the potential long-term target could reach approximately:
🔥 32
Yes… 32.
Now let's look at the time cycles. ⏳
The first major bullish leg developed ov
Yanbu National PetroChem : Is the Next Leg Up Forming ?TADAWUL:2290
📈 EMA 200 Retest + Bullish Divergence: Is the Next Leg Up Forming?
Price is now approaching the 200-week EMA at 34.23—a level that has historically acted as a major decision zone.
Looking at previous price behavior, the asset has repeatedly struggled to sustain above the 200-week EMA and experienced significant pullbacks around:
🔹 July 2023
🔹 October 2024
🔹 September 2025
🔹 April 2026
However, the current setup is showing some important differences.
The weekly chart has form
Sedco Capital Reit Fund : From Deep Discount to Potential 14–16TADAWUL:4344
📈 From Deep Discount to Potential 14–16 Target? The Weekly Chart Tells an Interesting Story 🔥
The weekly chart suggests that price may have completed a major accumulation and recovery phase after rebounding from a deep discounted Fibonacci retracement zone of the previous bullish swing from 4.14 to 11.00.
🔍 The Price Structure
After the initial bullish move, price retraced within a descending parallel channel, eventually forming a significant swing low near 5.91 in November 20
Americana : Is a Breakout Around the Corner ?TADAWUL:6015
📈 5-Week Consolidation: Is a Breakout Around the Corner? 🚀
After spending nearly five weeks consolidating around the 2.00 level, price continues to hold within a tight range, with the recent swing high forming near 2.09.
This prolonged consolidation is becoming increasingly interesting from a price action and technical analysis perspective.
🔍 Key Technical Structure
🔹 Trendline support remains intact, suggesting buyers are still defending the underlying structure.
🔹 Price
EURO STOXX 50 ($STOXX50) Daily: Testing Key EURO STOXX 50 ( ICMARKETS:STOXX50 ) Daily: Testing Key LTA Channel Support at 6,178 — Bullish Rebound vs. Deep Correction
### 🇪🇺 EURO STOXX 50 Index ( ICMARKETS:STOXX50 ) Daily Technical Framework (Ref: STOXX50_2026-07-21_09-27-32.png)
We are releasing a tactical multi-week technical study on the EURO STOXX 50 Index ( ICMARKETS:STOXX50 ) on the Daily (1D) interval. Following a corrective dip from its major high at 6,636.73, the European benchmark index is testing a critical structural boundary
XAUUSD: Bearish Structure – Multiple Selling Opportunities AheadMarket Structure Overview:
Gold remains in a clear downtrend on the higher timeframes. We are seeing consistent lower highs and lower lows, with sellers dominating the price action.
Key Selling Zones: Immediate Selling Zone: 4350 – 4370
Strong Bearish Order Block in the current downtrend. High probability for short entries with good risk-reward.
Break & Sell Setup: 3945 – 3950
If price breaks the bullish trendline, this level becomes a strong retest area for aggressive shorts.
Long-Term Buying
MASON XAUUSD – Key Support And Resistance Setup
XAUUSD is trading around 4,010 after recovering from the lower support area, but price is still moving below the main descending trendline. The short-term reaction shows buyers are defending the support zone, but the broader structure still needs confirmation before a stronger bullish move can be trusted.
The priority plan is to trade from strong support and resistance zones, with sell pressure still favoured if gold rejects from the upper Fibonacci resistance areas.
Technical View
Gold is c