BTCUSDT Weekly LONG IDEA (7-Point Confluence Zone)BTCUSDT — Long Bias | Liquidity Sweep into 7-Point Confluence Zone
━━━━━━━━━━━━━━━━━━━━━━━━━━━━━━━━━━━━━━━━
MACRO CONTEXT
Multi-timeframe bias is fully aligned bullish — Macro, HTF, and Intraday structures all point in the same direction. Despite this, price has been stalling around the 77,400–77,500 area with no real conviction in either direction. This type of price behavior — failure to advance in the direction of the prevailing trend — is a classic precursor to a liquidity sweep before continuation. The path of least resistance is a brief dip to collect sell-side liquidity below current price before the next leg higher.
━━━━━━━━━━━━━━━━━━━━━━━━━━━━━━━━━━━━━━━━
THE CONFLUENCE ZONE
The area of interest sits approximately 300–600 points below current price and is built from seven independent confluences across multiple methodologies:
Volume-Based:
Anchored Volume Profile POC — the Point of Control represents the price level with the highest traded volume in the anchored range. Institutional orders tend to cluster here.
Session nPOC (Naked POC) — an untested POC from a prior session sits at the same level. Naked POCs act as price magnets until they are mitigated. The alignment of the session nPOC with the AVP POC creates a double-layered volume node.
Technical Structure:
Weekly Fibonacci Retracement — the 0.618 retracement of the previous week's range falls directly into this zone, confirming it as a key institutional retracement level.
Macro Levels:
Yearly VWAP — price trading above the yearly VWAP is the defining characteristic of a macro bull market. A retest of this level is a high-probability long entry.
Quarterly VWAP — the Q2 VWAP adds a second layer of dynamic support at the same zone, reinforcing the macro significance of this area.
50-Day Moving Average — the 50D MA is currently converging with the VWAP cluster, further compressing the support into a narrow, well-defined range.
Intraday Confirmation:
Initial Balance (IB) Levels and Session Open — while less significant than the macro and volume-based confluences, intraday structure levels also align with this zone. Their presence adds an additional layer of institutional awareness at this price.
In total, seven confluences stack at this level — three from volume analysis, one from price structure, two from macro VWAP derivatives, and one from momentum. This is not a coincidence. It is the kind of zone that large participants defend.
━━━━━━━━━━━━━━━━━━━━━━━━━━━━━━━━━━━━━━━━
UPSIDE TARGETS
Target 1 — Previous Week High (PWH) : An unmitigated liquidity pool sitting above current price. Short sellers who faded the prior weekly high have stops resting just above it. Taking this liquidity is the natural first objective of any bullish move.
Target 2 — Open Fair Value Gap : A Fair Value Gap (FVG) created during the most recent pullback remains unfilled. Price gravitates toward open imbalances. This is the full measured target for the move.
━━━━━━━━━━━━━━━━━━━━━━━━━━━━━━━━━━━━━━━━
INVALIDATION
A decisive close below the confluence zone on strong volume would invalidate the long thesis and suggest a deeper structural shift. Until that happens, the bias remains long on any test of this level.
━━━━━━━━━━━━━━━━━━━━━━━━━━━━━━━━━━━━━━━━
This is not financial advice. Always apply your own risk management.  Long
Long
 Education
ETHUSD: Into the Eye of the Storm — Decoding the Final “C” WaveThe market is filled with noise right now, but for those who study the Elliott Wave structure, the signal is becoming clearer by the day. We are currently navigating the final, most crucial stage of a complex “Flat” correction in Ethereum (ETHUSD).
For those new to Elliott Wave:
Think of a “Flat” correction as a spring being compressed. The market is winding up, gathering energy. We’ve seen the impulsive moves, and now we are in the “C” wave — the final shakeout before the next major bull run. It’s often the most painful part of the cycle, but it’s exactly where the “Smart Money” begins to position itself.
The Strategy: The “Blue Box” & The Path Ahead
I am currently monitoring the “Blue Box” on the chart (1806 - 880 USD). This is our theater of operations. We are looking for the completion of the 5th micro-wave within this zone.
How to trade this (The Confirmation):
The “No-Guessing” Rule: We do not trade against the trend until structure confirms it.
The Breakout: Our “Red Corrective Channel” is the line in the sand. A decisive daily close above this channel, paired with a breakout from the initial correction, is our primary confirmation.
Conservative vs. Aggressive: The conservative approach waits for the move above $3,439. The aggressive approach watches the reaction inside the “Blue Box” for an entry with a tight stop-loss.
Market Sentiment:
Fear is high. The crowd is looking for the “bottom,” but they are looking at price instead of structure. Remember, market sentiment is a lagging indicator. While the masses are waiting for more news, the patterns are already whispering the truth. Stay patient. Let the market prove the trend, then execute.
Patterns whisper. Structure decides. The market executes.
— Mr. Nobody 🎭
Long 
Ethereum’s Long-Term Odyssey (2030-2040): The Road to $492K via Ethereum’s Long-Term Odyssey (2030-2040): The Road to $492K via Wave (III)
Hello Traders! 🚀
As an Elliott Wave enthusiast, I’ve been dissecting Ethereum’s long-term structure since 2015. Today, I’m sharing my “Aggressive Idea” for the next decade of market evolution.
Key Technical Observations:
Cycle Degrees: We completed the massive Wave (I) at the 2021 peak. Since then, we have been meticulously navigating a complex Wave (II) correction.
The “Ruining” Flat: Currently, ETH is in the late stages of a Running/Regular Flat structure in Wave (II). The recent price action hints at a final 5th wave completion—likely involving a minor truncation or final washout—before the massive breakout.
Alternation Principle: Looking ahead, I anticipate the future Wave IV (expected around the turn of the decade) will contrast sharply in character, providing a unique rhythm to this long-term trend.
The Launchpad: We are currently consolidated within the 14.6% - 23.6% Fibonacci Retracement zone. In the context of an extended cycle, this shallow retracement is a hallmark of extreme underlying bullish strength.
The Projected Targets:
First Stop: $9,984 (Psychological & Technical pivot)
The Heart of Wave III: $29,285
The “Moon Shot”: 167K−492K (Extended Wave III targets projected for 2030-2040)
Bottom Line:
The “Corrective Channel” (red line) is our final frontier. Once broken, Ethereum enters the most powerful sub-wave of the Supercycle. ETH historically leads in momentum; expect it to set the pace for the entire crypto space.
“In Elliott Wave, we don’t just trade price; we trade the human psychology reflected in time. Patience, our primary indicator.”
Market sentiment isn’t fixed; it’s a fluid process of structural verification. We remain neutral, waiting for the price to confirm whether the symphony of waves points to an immediate recovery or a final corrective dip.
Patterns whisper. Structure decides. The market executes.
The symphony of Elliott Waves and the music of market cycles create a unique harmony. Listen closely.
- Signed, Mr. Nobody 🎭
Evidence to start the uptrend (Jun 22, 2022)
The rise of Ethereum is more likely, until the extension of the (Jan 30, 2023)
Big Move !! 5 Wave (Aug 4, 2023)
Diagonal Pattern For Big Move Upside (Sep 13, 2023)
Simpel Flat??? Sharp ???Big Flat (Sep 7, 2023)
Diagonal pattern?? or 1.2-1.2 (Oct 18, 2023)
1.2&1.2 Or Diagonal?? (Nov 16, 2023)
For now, the flat correction pattern has been extended (Jan 23, 2024)
Long 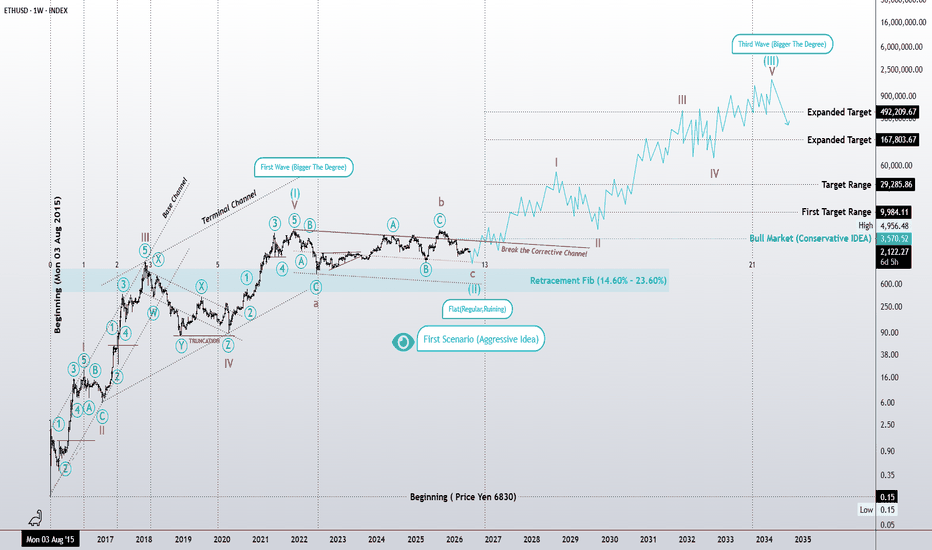
EURUSD - Consolidation above key resistanceFX:EURUSD opened the week with a bullish gap amid hopes for a U.S.-Iran peace deal, erasing the previous week’s decline to a low of 1.1575
The euro is caught in a stagflation trap: weak PMIs and the risk of recession are causing the market to doubt the ECB’s ability to tighten policy, despite inflation above 3%. Technically, the focus is on the 1.16357–1.1660 range. Continued optimism regarding the situation in the Middle East could support further gains (the market may strengthen from 1.1635 toward 1.168–1.1722)
Resistance levels: 1.1635, 1.168, 1.1722
Support levels: 1.1627, 1.1583
Technically, there are attempts to break the local structure; the reason is a gradual shift in the geopolitical backdrop and a weakening dollar, which presents opportunities for the euro.
If the bulls keep the price above 1.1635, this could become a technical driver for growth
Best Regards, R. Linda! GOLD - The geopolitical backdrop is changing ICMARKETS:XAUUSD closed Friday’s session near 4,500 and looks fairly weak, with a bearish bias. However, the geopolitical backdrop is shifting over the weekend, which could trigger a gap or a locally positive tone in the market
Following a phone call between Middle Eastern countries and the U.S., Trump stated: “The agreement is largely agreed upon and awaits final approval between the United States of America, the Islamic Republic of Iran, and various other countries.”
On May 22, the new Fed Chair Kevin Warsh was officially sworn in, promising a “reformist” approach but emphasizing independence from the White House. Key catalysts for the coming week: U.S. GDP data (Q1), core PCE (the Fed’s inflation indicator, May 28), as well as developments in the Iran negotiations.
Resistance levels: 4540, 4589, 4646
Support levels: 4500, 4488, 4465
Technically, the market may react quite positively to the shift in the geopolitical backdrop. Bulls may hold the 4500 area, and at the session open, the price may open with an upward gap or continue its movement sharply; a breakout of the local trend line could strengthen the momentum.
There is a possibility of growth to 4589 - 4646 - 4734
Best regards, R. Linda!  Long
Long
$DVA Revenue Beat. Guidance Beat. Share Buybacks Running....Most healthcare investors overlook DaVita. 🏥 That is a mistake. DaVita is the largest independent provider of kidney dialysis services in the United States, operating over 3,200 outpatient centres across the US and internationally. 🌐
The patient base is not discretionary. Chronic kidney failure and end stage renal disease do not go away in a downturn. This is one of the most defensible revenue streams in the entire healthcare sector. 🔒
Q1 2026 results came in ahead of expectations on every meaningful metric. 📊 Revenue hit $3.42 billion, up from $3.22 billion in Q1 2025, beating the consensus estimate of $3.39 billion. 💰 Adjusted EPS from continuing operations came in at $2.87, up 43.5% year over year, beating the Zacks consensus of $2.34 by 19.1%. 🤯 Net income rose to $197.5 million from $162.9 million a year earlier. Operating cash flow strengthened to $320.8 million from $180 million in the same quarter last year. 💵
Management did not just beat. They raised. 📈 Full year 2026 adjusted EPS guidance was lifted to a range of $14.10 to $15.20, up from the prior outlook of $13.60 to $15.00. 🎯
Full year adjusted operating income guidance was raised and narrowed to $2.15 billion to $2.25 billion. CEO Javier Rodriguez cited higher volume expectations and lower patient care costs as the drivers behind the upgrade. 🚀
The structural story is getting stronger too. 💪 DaVita's Integrated Kidney Care segment, which manages risk based contracts covering roughly $5.6 billion in annual patient spending, turned profitable in 2025, one year ahead of schedule. 🏆
The company also signed a $200 million minority investment in Elara Caring alongside Ares Private Equity, building a kidney specific home care model targeting reduced hospitalisations for the roughly one quarter of DaVita's patients who use home health. 🤝
DaVita is actively deploying AI tools across clinical and operational use cases, including ScheduleHub, a real time scheduling tool that dynamically processes patient census, capacity, and staffing data across every centre. 🤖
On top of all of this, the share buyback machine is running hard. ♻️ DaVita repurchased 3.0 million shares in Q1 2026 at an average price of $133.70 per share. A shrinking share count amplifies EPS growth with every passing quarter.
The 52 week range sits between $101.00 and $202.69. The analyst consensus average price target is $193.71. 📉
The daily chart has pulled back from the 52 week high into a clean demand zone at the 0.786 Fibonacci retracement. ✅ The risk is defined. The fundamentals are accelerating.
This is the entry. 📊
🟢 Buy Zone ~ $159.52 area (0.786 Fibonacci Daily)
Daily demand zone with Fibonacci confluence. Price has retraced from highs into a level where institutional buyers are active.
💰 Entry: $159.52
🛑 Stop: $154.78 (2.971% below entry)
🎯 Target: $194.30 (21.8% upside from entry)
📈 Risk/Reward Ratio: 7.34
📅 Next Earnings: Q2 2026
The revenue beat. The guidance beat. The buybacks are running. Let price come to the zone and let the trade do the work. 🚀
⚠️ Not financial advice. Manage your risk.  Long
Long
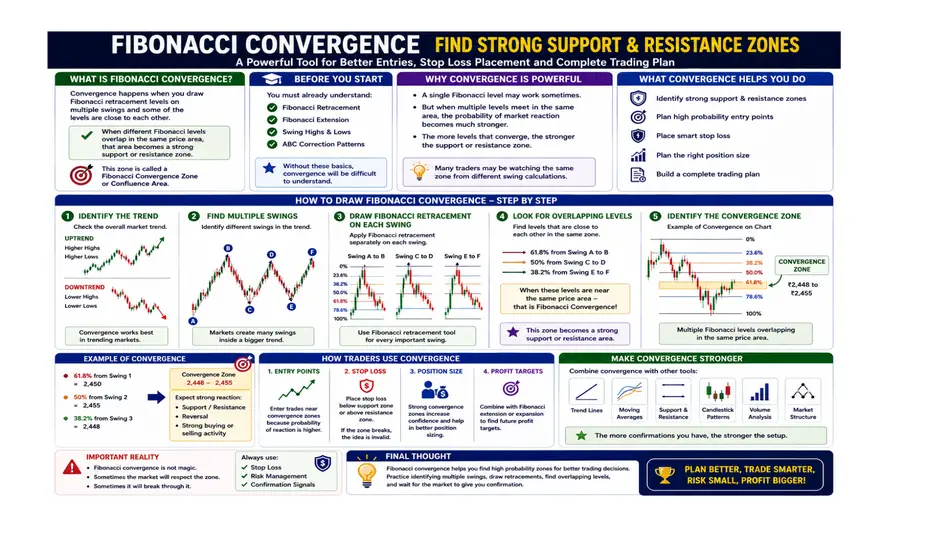
Fibonacci Convergence: Finding Strong Support and ResistanceUnderstanding Fibonacci Convergence in Trading
*******************************
In the previous articles, we learned:
Day 01: Fibonacci Trading Tools
Day 02: Fibonacci Retracement Trading Strategy for Beginners
Day 03: Fibonacci Projection: Finding Exit Points in Trading
Today, we will learn one of the most powerful Fibonacci concepts:
Fibonacci Convergence
^^^^^^^^^^^^^^^^^^^^^^
This is one of the last major Fibonacci concepts beginners should learn before moving toward advanced trading techniques.
Fibonacci convergence helps traders:
Identify strong support and resistance zones
Plan entry and exit points
Decide stop loss placement
Manage position size
Build a complete trading plan
Important Before Learning Fibonacci Convergence
^^^^^^^^^^^^^^^^^^^^^^
Before studying Fibonacci convergence, you should already understand:
Fibonacci Retracement
Fibonacci Extension
Swing highs and swing lows
ABC correction patterns
Without understanding these basics, convergence may look confusing.
What Is Fibonacci Convergence?
*******************************
Market trends are built from many smaller swings inside one bigger trend.
Fibonacci convergence happens when:
You draw Fibonacci retracement levels on multiple swings, and
Different Fibonacci levels appear close to each other in the same price area
When several Fibonacci levels meet near the same zone, that area becomes a stronger support or resistance level.
This area is called a:
Fibonacci Convergence Zone
Fibonacci Cluster
Confluence Area
Professional traders pay close attention to these zones because the market often reacts strongly there.
Why Fibonacci Convergence Is Powerful
*******************************
A single Fibonacci level may work sometimes.
But when:
38.2% from one swing, and
61.8% from another swing
appear near the same price area, the probability of market reaction becomes stronger.
This is because multiple traders may be watching the same area from different swing calculations.
The more Fibonacci levels that meet together, the stronger the support or resistance zone may become.
How to Draw Fibonacci Convergence
*******************************
Let’s learn step-by-step.
Step 1: Identify the Main Trend
^^^^^^^^^^^^^^^^^^^^^^
First, check whether the market is in:
An uptrend (Higher highs and higher lows)
A downtrend (Lower highs and lower lows)
Remember: Fibonacci convergence works best in trending markets.
Step 2: Find Multiple Swings
^^^^^^^^^^^^^^^^^^^^^^
Now identify different price swings on the chart.
For example:
Large swing: A → B
Smaller swing inside the trend: C → D
Another correction swing: E → F
The market usually creates many swings inside one trend.
Step 3: Draw Fibonacci Retracement Levels on Each Swing
^^^^^^^^^^^^^^^^^^^^^^
Apply Fibonacci retracement separately on every important swing.
For example:
Draw Fibonacci from Swing A to B
Draw another Fibonacci from Swing C to D
Draw another Fibonacci from Swing E to F
Your chart may start looking crowded. That is normal.
Step 4: Look for Overlapping Levels
^^^^^^^^^^^^^^^^^^^^^^
Now carefully observe the retracement levels.
Suppose you see:
61.8% retracement from one swing
50% retracement from another swing
38.2% retracement from a third swing
all located near the same price zone. This is Fibonacci convergence. That price area becomes an important support or resistance zone.
Example of Fibonacci Convergence
^^^^^^^^^^^^^^^^^^^^^^
Imagine this setup:
Swing 1 → 61.8% retracement at $2,450
Swing 2 → 50% retracement at $2,455
Swing 3 → 38.2% retracement at $2,448
All these levels are very close.
So the zone between: $2,448 to $2,455
becomes a strong Fibonacci convergence area.
Traders may expect:
Price reversal
Strong support
Strong resistance
Heavy buying or selling activity
near that area.
How to Make Fibonacci Convergence Stronger
*******************************
Fibonacci convergence becomes more powerful when combined with:
Trend lines
Moving averages
Support and resistance
Candlestick patterns
Volume analysis
Market structure
Example:
If a convergence zone also matches: 200 Moving Average, Previous support zone and Bullish candlestick pattern then the setup may become much stronger .
Fibonacci convergence is one of the most powerful concepts in Fibonacci trading.
Important: Fibonacci convergence is not magic. Sometimes the market will respect the zone. Sometimes it will break through it completely. That is why traders must always use: Stop losses, Risk management, and Confirmation signals
Never trade only because Fibonacci levels overlap.
 Education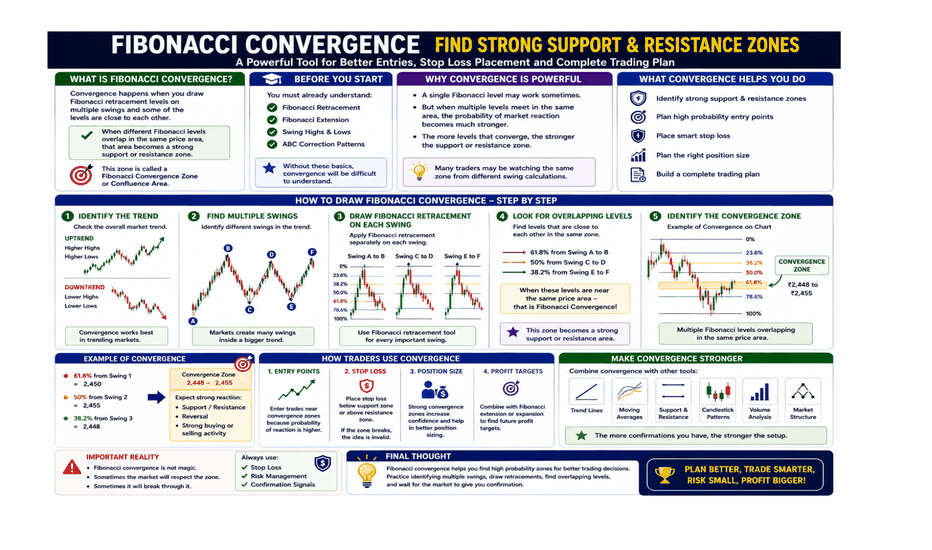
BITCOIN - The hunt for liquidity ahead of the fall BINANCE:BTCUSDT.P has hit a new low of $76K and is testing local support; due to a lack of liquidity, the market may form a correction toward the imbalance zone...
Bitcoin’s global trend is bearish, within which a local bullish channel is forming, aimed at consolidation. A break of the local upward support returns the market to a bearish environment.
Technically, the price is testing the 76,100 support level and forming a correction aimed at seeking liquidity. Key levels to watch include 78,300, 78,700, and 79,460. A short squeeze and the formation of a reversal pattern could return the price to a downward trend
Resistance levels: 77,600, 78,700, 79,460
Support levels: 76,100, 75,600
Focus on the 77,600 consolidation resistance; a breakout could trigger an upward impulse toward the 78,700 imbalance zone in a liquidity hunt. A short squeeze in the resistance zone could return Bitcoin to a downtrend.
Best Regards, R. Linda! Short 
 Short
Short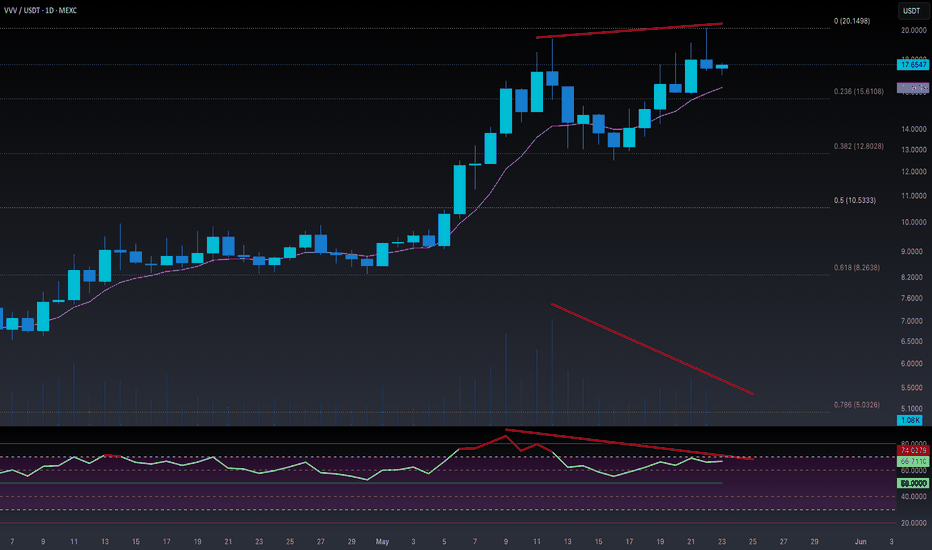
Fibonacci Retracement Trading Strategy for BeginnersUnderstanding the ABC Pattern and Retracement Levels
In the previous article , we learned about the most popular Fibonacci retracement levels:
23.6%
38.2%
50%
61.8%
78.6%
If you missed the previous article, make sure to read it first.
Today, we will learn how to use these retracement levels with the ABC pattern.
Why Prices Move in Waves
+-+-+-+-+-+-+-+-+-+-+-+-+
Prices rarely move in one direction for a long time. Sometimes, after major news or events, the market may suddenly skyrocket or crash, making trading difficult.
Most of the time, prices move in a zigzag pattern called waves. This idea comes from the Elliott Wave Theory.
We will study Elliott Wave Theory in a future tutorial. For now, our goal is to understand Fibonacci retracement levels in a simple way.
Understanding the ABC Pattern
+-+-+-+-+-+-+-+-+-+-+-+-+
First, you need to identify a market swing:
A move from Point A to Point B is called the impulsive wave.
A move from Point B to Point C is called the corrective wave.
Point C should stay between Point A and Point B.
It is not always easy to identify the ABC pattern correctly. It takes practice, patience, and experience.
How to Draw Fibonacci Retracement Levels
+-+-+-+-+-+-+-+-+-+-+-+-++-+-+-+-+-
After finding the ABC move:
Select the Fibonacci Retracement tool on your charting platform.
Draw the tool from the low at Point A to the high at Point B in an uptrend.
In a downtrend, draw it from the high to the low.
For more accurate results, use candlestick charts instead of line charts or area charts.
Should the Price Exactly Touch the Retracement Level?
+-+-+-+-+-+-+-+-+-+-+-+-++-+-+-+-+-+-+-+-+-+-
Many beginners believe the price must perfectly touch the retracement level.
That is not always true.
Sometimes the price may reverse slightly above or below the level. If the market reacts near the retracement zone, the setup may still be valid.
Which Retracement Levels Are Important?
+-+-+-+-+-+-+-+-+-+-+-+-+-+-+-+-+-
The standard retracement levels are:
23.6%
38.2%
50%
61.8%
78.6%
Note: The 50% level is not officially part of the Fibonacci sequence, but traders still consider it very important.
Where Should You Enter a Trade?
+-+-+-+-+-+-+-+-+-+-+-+-+-+-
There are three common approaches.
Door 1 — Aggressive Entry (Highest Profit Potential)
*********
You enter the trade when the price reaches a retracement level such as:
61.8%
50%
38.2%
You assume the correction is ending and Point C has formed.
This strategy offers high profit potential, but it also carries higher risk.
Door 2 — Confirmation Entry (Moderate Risk)
*********
Instead of entering immediately, wait for confirmation.
For example:
The price reacts near 61.8%
An oscillator gives a signal
Moving averages support the move
A bullish or bearish candlestick appears
After confirmation, you can enter the trade.
This method reduces the chance of failure compared to Door 1.
Door 3 — Safe Entry ( Recommended for Beginners )
*********
Wait until the price breaks above the recent high in an uptrend, or below the recent low in a downtrend.
This is the safest approach because the trend confirmation is stronger.
However, the possible profit may be smaller compared to earlier entries.
Which Entry Method Is Best?
+-+-+-+-+-+-+-+-+-+-+-+-+-+-
The answer depends on:
Your experience
Your risk-taking ability
Your market knowledge
Your trading psychology
Remember: You do not need to catch the exact bottom or top to make money. If you enter after the correction ends, you are already ahead of many traders and investors.
Stop Loss Using Fibonacci Retracement
+-+-+-+-+-+-+-+-+-+-+-+-+-+-
Fibonacci retracement levels are also useful for placing stop losses.
For example:
If you enter a long trade near Point C, Point A can act as your stop loss.
If the entry is near the 61.8% retracement level, some traders may place a tighter stop near the 78.6% level.
Fibonacci levels can also help with trailing stop losses.
Combination Strategy 1: Fibonacci + Trend Lines
+-+-+-+-+-+-+-+-+-+-+-+-+-+-
Fibonacci tools work especially well in trending markets.
You can combine Fibonacci retracement levels with trend lines to:
Identify strong support and resistance
Spot possible breakout areas
Place stop losses below the trend line
No strategy works every time, but this combination often offers:
Small potential risk
Larger potential reward
Combination Strategy 2: Fibonacci + Support and Resistance
+-+-+-+-+-+-+-+-+-+-+-+-+-+-
Another powerful method is combining Fibonacci retracement levels with important support and resistance zones.
These support or resistance areas may come from:
Previous highs
Previous lows
Important market reaction zones
You can also strengthen this strategy using moving averages such as:
10 MA
20 MA
50 MA
100 MA
200 MA
Example
If the:
50 Moving Average, and
50% retracement level
are located near the same price area, that zone may become a strong support level.
Final Thoughts
+-+-+-+-+-
Fibonacci retracement is not a magic system.
It is a tool that helps traders understand:
Market corrections
Trend continuation
Support and resistance
Risk management
The more you practice identifying ABC patterns and retracement zones, the better your understanding of market behaviour will become.
In the next article, we will explore Fibonacci projections and convergence. Education 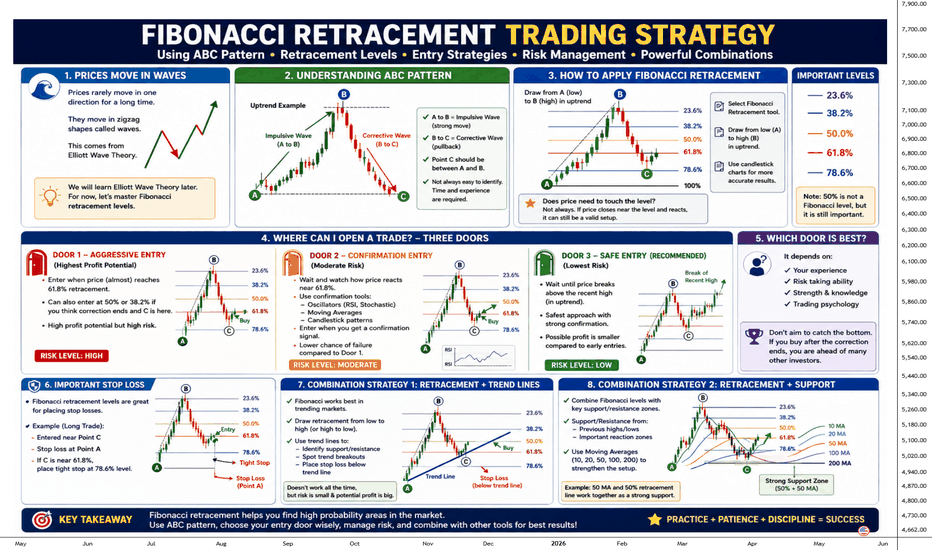
GOLD - The pressure of the global bearish trendICMARKETS:XAUUSD is trading near the key daily support level of 4,510; the reaction within the long squeeze is weak, and the market continues to maintain a bearish structure. Meanwhile, the dollar is stagnating
Gold received support from geopolitical optimism on Wednesday, but the Fed’s hawkish stance and the possibility of a breakdown in negotiations are holding back gains. Today’s PMI data and developments regarding Iran will determine whether gold can hold above $4,600
Technically, the market is under pressure from bears within the medium-term trend. Locally, the focus is on two key triggers: the control point and the liquidity zone at 4,540. The second key zone is the resistance of the current local range at 4,588–4,607.
Resistance levels: 4,540, 4,588, 4,607
Support levels: 4,510, 4,565, 4,400
Locally, the dollar is stagnating due to geopolitics, but at the same time, consolidation is forming above key support, which is generally putting pressure on the metal. After hitting a new low, gold is forming a correction and closing within the 4465–4588 range; the reaction from the bulls is relatively weak. A short squeeze at 4540 (second trigger at 4588) could trigger a decline. A close below 4510 could trigger a drop to 4400
Best Regards, R. Linda! Short 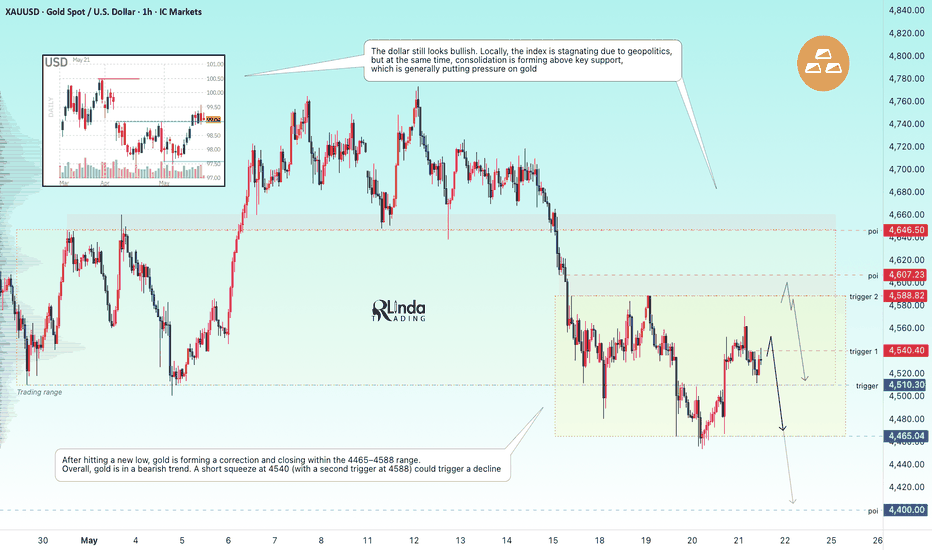
 Long
Long
 Long
Long
Understanding Fibonacci Trading ToolsWhy Fibonacci Tools Are Better Than Traditional Technical Analysis Tools
+-+-+-+-+-+-+-+-+-+-+-+-+-+-+-+-+-+-+-+-+-+-+-+-+-+-+-+-+-+-+-+-+-+-+-+-+-+-+-
Many people still believe that buying stocks of old and strong companies and holding them for years is the best way to make money. They think long-term investing is always better than disciplined short-term trading.
But investors should understand one important thing: during a financial crisis or recession, even good companies can fall sharply. When large investment funds face heavy withdrawals, they are forced to sell shares to return money to investors. At that time, they may sell shares of both weak and strong companies.
I have studied and cleared exams such as Research Analyst, Technical Analysis, Wealth Management, Derivatives, and also studied Series 65. In most technical analysis courses, people often say, “Trend is your friend.”
They teach indicators such as MACD, Moving Averages, RSI, CCI, and many other oscillators. These are called lagging indicators . A lagging indicator follows price movement after it has already started. It reacts to the trend instead of predicting a reversal.
But have you heard about leading indicators ?
There are many leading indicators, but today we will discuss one of the best tools: Fibonacci tools .
Fibonacci tools can help traders identify support and resistance levels before the price reaches them. Professional traders often use leading indicators because they want to enter and exit trades early.
Introduction to Fibonacci Numbers
+-+-+-+-+-+-+-+-+-+-+-+-+-+-+-+-+-+-+
Leonardo Pisano Bigollo, born around 1170 in Italy and better known as Leonardo Fibonacci, introduced the Fibonacci sequence to the Western world through his book Liber Abaci. Interestingly, Indian mathematicians already knew about this sequence centuries earlier.
The Fibonacci sequence starts like this:
0
1
0 + 1 = 1
1 + 1 = 2
1 + 2 = 3
2 + 3 = 5
3 + 5 = 8
5 + 8 = 13
…and so on.
Each number is created by adding the previous two numbers together.
Fibonacci Ratios and Retracement Levels
+-+-+-+-+-+-+-+-+-+-+-+-+-+-+-+-+-+-+-+-+-+
Fibonacci ratios are created by dividing one Fibonacci number by the next number in the sequence.
Examples:
5 ÷ 8 = 0.625
13 ÷ 21 = 0.619
89 ÷ 144 = 0.618
The value 0.618 is known as the Golden Ratio . We will understand this concept in detail with examples in upcoming educational articles.
These ratios are also used as retracement levels in trading.
The most popular Fibonacci retracement levels are:
23.6%
38.2%
50%
61.8%
78.6%
Note: The 50% retracement level does not come directly from the Fibonacci sequence, but traders still consider it an important level.
Understanding Price Behaviour
+-+-+-+-+-+-+-+-+-+-+-+-+-+-+-+-+
Before learning Fibonacci tools deeply, we first need to understand how price behaves in the market.
What Happens When There Is No Trend?
If there is no strong trend, the market usually moves sideways in a range.
Statistics suggest that markets trend only about 30% of the time. The rest of the time, prices move sideways.
During sideways markets, there is no clear direction. It becomes difficult to make profitable trades. Smart traders often wait patiently for a strong trend to return before entering the market.
How to Identify an Uptrend and a Downtrend
+-+-+-+-+-+-+-+-+-+-+-+-+-+-+-+-+-+-+-+-+-+-+-+
Uptrend
An uptrend happens when the price creates:
Higher highs
Higher lows
Downtrend
A downtrend happens when the price creates:
Lower highs
Lower lows
Sometimes you may see prices moving straight up or straight down very quickly. This usually happens because of unexpected news or major events.
If you trade Forex or international commodities, always pay attention to the economic calendar.
Why I Am Writing This Article
+-+-+-+-+-+-+-+-+-+-+-+-+-+-+-+
Some courses claim to teach a “magic trading system” based on Fibonacci tools. Many of these courses cost between $799 and $999.
But remember this clearly:
There is no magic system in trading.
No indicator or strategy can guarantee profits every time.
Whether you trade stocks, Forex, commodities, or bonds, you will find Fibonacci ratios used everywhere because they help traders understand market behaviour better.
What’s Next?
+-+-+-+-+-+-+
In the next article, we will study Fibonacci retracement levels in greater detail and learn how traders use them in real market conditions. Education 
HCL Technologies — 61.8% Fib Breakout Setup💻 HCL Technologies — 61.8% Fib Breakout Setup
CMP: ₹1,668
Stop Loss: ₹1,580
Targets: ₹1,747 / ₹2,002
🔍 Price Action View
Amid ongoing tariff-related news flow and elevated volatility, HCL Tech is emerging as one of the stronger names within the IT pack.
Key technical highlights:
Formation of a clear double bottom structure
₹1,747 is the critical level — it marks both the neckline of the pattern and the 61.8% Fibonacci retracement
A decisive breakout above ₹1,747 can trigger fast upside expansion, with momentum carrying the stock towards the ₹2,002 zone
This is a break-with-force setup — follow-through strength above 1,747 will be the confirmation.
⚠️ Risk & Execution Note
With high volatility in global markets, risk management becomes more important than prediction.
⚠️ Trading Approach
This is a patience trade, not a momentum chase
Reduce position sizing due to volatility
Let the price structure confirm and expand
Avoid over-leveraging; give the setup enough room
⚠️ Clarification:
This is an independent analysis based purely on technical and market study. No part of Religare is involved in this view or recommendation.
📝 Important:
I am not responsible for any loss or profit incurred. I am not taking any fees for these views – just sharing my analysis for educational and informational purposes.
📉 Disclaimer:
Not SEBI-registered. Please do your own research or consult a financial advisor before taking any investment decision.  Long
Long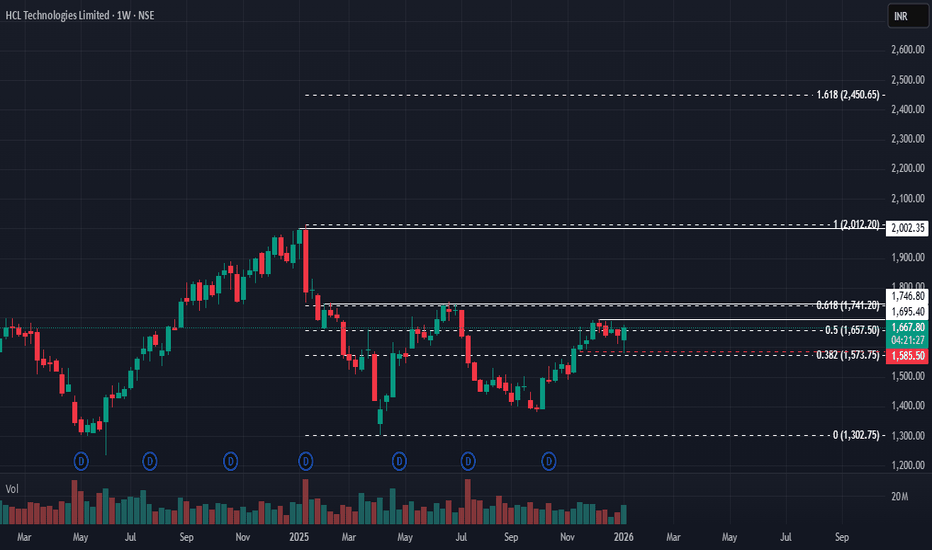
 Long
Long
 Long
Long
 Long
Long
 Long
Long
 Long
Long