Long
Long
 Long
Long

ServiceNow: Potential Bearish FlagServiceNow has treaded water for about six months, and some traders may think it’s ready to sink.
The first pattern on today’s chart is the series of higher lows since April 10. The cloud-computing stock has remained near that line without reversing higher. Could it be a bearish flag with breakdown potential?
Second, the 50- and 100-day simple moving averages (SMAs) are near each other. Both are under the 200-day SMA. That may reflect intermediate-term consolidation within the context of a longer-term downtrend.
Third, NOW tried to rally last month but was halted at the January 26 pre-earnings peak.
TradeStation has, for decades, advanced the trading industry, providing access to stocks, options and futures. If you're born to trade, we could be for you. Learn more here about TradingView’s Broker of the Year!
Past performance, whether actual or indicated by historical tests of strategies, is no guarantee of future performance or success. There is a possibility that you may sustain a loss equal to or greater than your entire investment regardless of which asset class you trade (equities, options or futures); therefore, you should not invest or risk money that you cannot afford to lose. Online trading is not suitable for all investors. View the document titled Characteristics and Risks of Standardized Options at www.TradeStation.com . Before trading any asset class, customers must read the relevant risk disclosure statements on www.TradeStation.com . System access and trade placement and execution may be delayed or fail due to market volatility and volume, quote delays, system and software errors, Internet traffic, outages and other factors.
Securities and futures trading is offered to self-directed customers by TradeStation Securities, Inc., a broker-dealer registered with the Securities and Exchange Commission and a futures commission merchant licensed with the Commodity Futures Trading Commission). TradeStation Securities is a member of the Financial Industry Regulatory Authority, the National Futures Association, and a number of exchanges.
TradeStation Securities, Inc. and TradeStation Technologies, Inc. are each wholly owned subsidiaries of TradeStation Group, Inc., both operating, and providing products and services, under the TradeStation brand and trademark. When applying for, or purchasing, accounts, subscriptions, products and services, it is important that you know which company you will be dealing with. Visit www.TradeStation.com for further important information explaining what this means.

 Long
Long
 Long
Long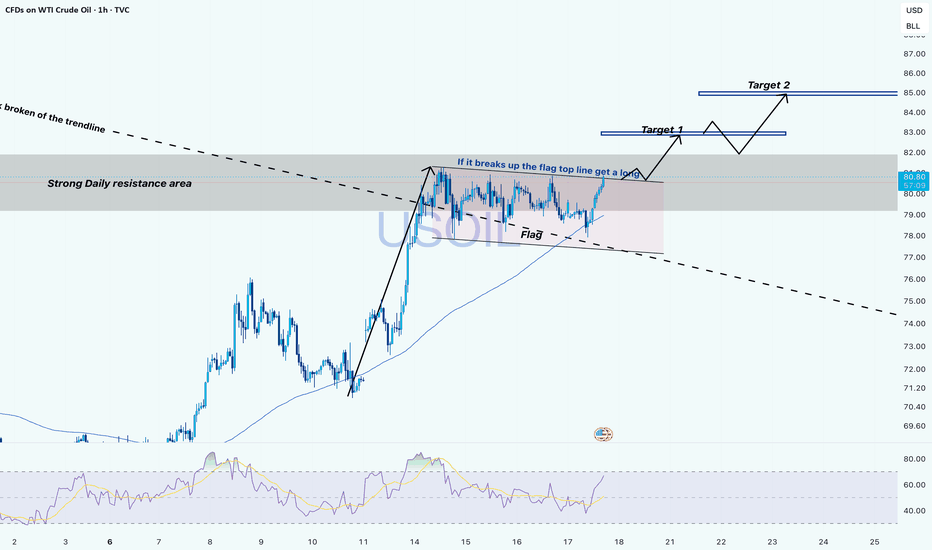
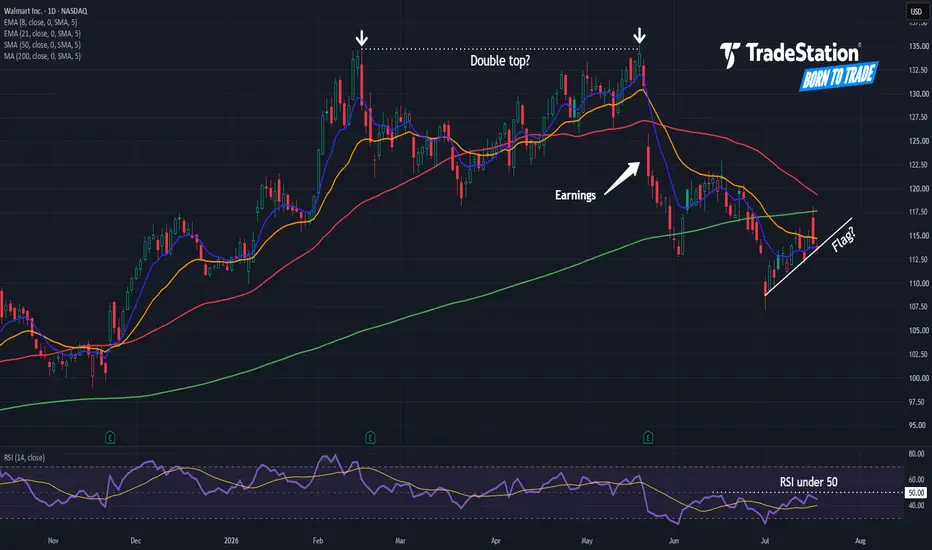
Walmart May Be Trending LowerWalmart had a big run between 2022 and early 2026, but now it may be going the other way.
The first pattern on today’s chart is the pair of peaks in February and May. That double top may signal a reversal of the preceding uptrend.
Second, the retail giant gapped lower after announcing results on May 21. It stayed below levels from the session before making another push to the downside. Prices then recovered. But is that bounce a potential bearish flag?
Third, the 8-day exponential moving average (EMA) is below the 21-day EMA. That may reflect a short-term downtrend.
Fourth, Wilder’s Relative Strength Index (RSI) has stayed under 50 after hitting oversold conditions. That may also be consistent with short-term weakness.
Finally, WMT is under its 50- and 200-day simple moving averages. That may reflect a longer-term reversal.
TradeStation has, for decades, advanced the trading industry, providing access to stocks, options and futures. If you're born to trade, we could be for you. Learn more here about TradingView’s Broker of the Year!
Past performance, whether actual or indicated by historical tests of strategies, is no guarantee of future performance or success. There is a possibility that you may sustain a loss equal to or greater than your entire investment regardless of which asset class you trade (equities, options or futures); therefore, you should not invest or risk money that you cannot afford to lose. Online trading is not suitable for all investors. View the document titled Characteristics and Risks of Standardized Options at www.TradeStation.com . Before trading any asset class, customers must read the relevant risk disclosure statements on www.TradeStation.com . System access and trade placement and execution may be delayed or fail due to market volatility and volume, quote delays, system and software errors, Internet traffic, outages and other factors.
Securities and futures trading is offered to self-directed customers by TradeStation Securities, Inc., a broker-dealer registered with the Securities and Exchange Commission and a futures commission merchant licensed with the Commodity Futures Trading Commission). TradeStation Securities is a member of the Financial Industry Regulatory Authority, the National Futures Association, and a number of exchanges.
TradeStation Securities, Inc. and TradeStation Technologies, Inc. are each wholly owned subsidiaries of TradeStation Group, Inc., both operating, and providing products and services, under the TradeStation brand and trademark. When applying for, or purchasing, accounts, subscriptions, products and services, it is important that you know which company you will be dealing with. Visit www.TradeStation.com for further important information explaining what this means.  Long
Long
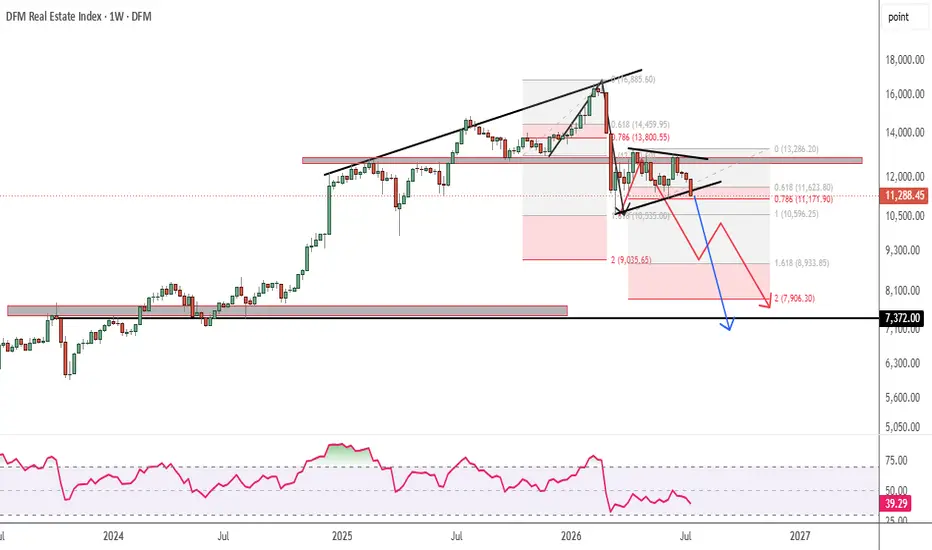
DFMREI : Is Downtrend Over ?DFM:DFMREI (Dubai Financial Markets Real Estate Index)
📉 Is the Downtrend Over? Reverse Fibonacci Suggests Another Leg Lower ⚠️
After rejecting from the 16.8k trendline resistance, the market continues to respect its broader bearish structure.
Here's what the chart is telling us:
🔹 The previous impulse moved from a 13k swing low to a 16.8k swing high, which also aligned perfectly with a major descending trendline resistance. Applying a Reverse Fibonacci Extension projected the 10.6k zone as the first major downside objective—and price respected it almost precisely during the sharp selloff triggered by the Middle East geopolitical conflict (highlighted by the black arrow).
🔹 The subsequent dead cat bounce stalled near 12.8k, a level that has repeatedly acted as both historical support and resistance, confirming it as a significant supply zone where sellers regained control.
What's Next?
Using the latest price structure:
Swing Low: 10.6k
Swing High: 12.8k
The prevailing trend remains bearish, with lower highs and lower lows still intact.
Projecting another Reverse Fibonacci 1.618 Extension identifies the 9k–8k demand zone as the next high-probability downside target (illustrated by the red path).
Adding further weight to the bearish outlook, the chart is also developing a Bearish Pennant / Bear Flag continuation pattern. If this structure confirms with a downside breakout, the measured move projects a final target around the 7.3k–7k region ( blue arrow marked )
Key Technical Confluences
✅ Reverse Fibonacci Extensions
✅ Bearish Pennant / Bear Flag Pattern
✅ Trendline Resistance Rejection
✅ Lower High–Lower Low Market Structure
✅ Historical Support & Resistance Flip
✅ Momentum Continuation Setup
My View
As long as price remains below 12.8k, rallies may continue to be selling opportunities rather than signs of a trend reversal.
A confirmed break below 10.6k could accelerate downside momentum toward the 9k–8k zone, while a completed bear flag projection opens the possibility of testing the 7k area.
What do you think? Is this simply another correction, or are we preparing for the next major leg down? Share your analysis below.
#TechnicalAnalysis #TradingView #PriceAction #ReverseFibonacci #FibonacciExtension #BearFlag #BearishPennant #ChartPattern #SupportAndResistance #TrendAnalysis #SwingTrading #MarketStructure #StockMarket #Crypto #Investing #Trading #Momentum #Breakdown #TrendFollowing #SmartMoney #VolumeAnalysis #ChartOfTheDay #TradeIdeas #MarketOutlook #Bearish
Btw, i had already shared the dead cat bounce scenario, proof below
Educational content only. Not financial advice.
 Long
Long
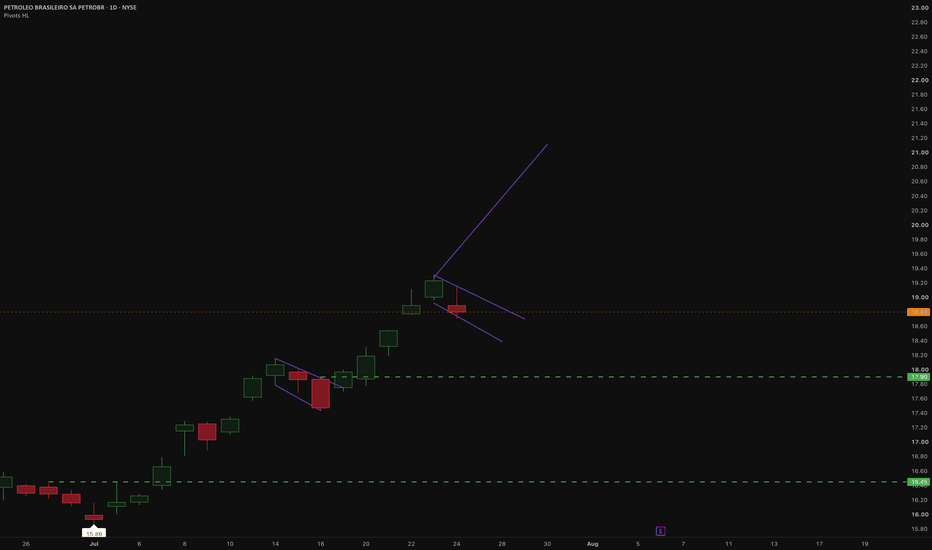
Upside in Occidental?Occidental Petroleum has been climbing this month, and some traders may see further upside.
The first pattern on today’s chart is the quick bounce since July 1. The oil driller has paused in the last three sessions. Could the pullback be viewed as a bullish flag?
Second, recent consolidation has occurred around the lows of April and May. That zone initially held OXY back, but now that resistance may be breaking.
Third, the recent bounce started at the 200-day simple moving average. That may confirm a bullish longer-term trend.
Finally, the 8-day exponential moving average (EMA) has crossed above the 21-day EMA. MACD is also rising. Those signals could indicate short-term bullishness.
TradeStation has, for decades, advanced the trading industry, providing access to stocks, options and futures. If you're born to trade, we could be for you. Learn more here about TradingView’s Broker of the Year!
Past performance, whether actual or indicated by historical tests of strategies, is no guarantee of future performance or success. There is a possibility that you may sustain a loss equal to or greater than your entire investment regardless of which asset class you trade (equities, options or futures); therefore, you should not invest or risk money that you cannot afford to lose. Online trading is not suitable for all investors. View the document titled Characteristics and Risks of Standardized Options at www.TradeStation.com . Before trading any asset class, customers must read the relevant risk disclosure statements on www.TradeStation.com . System access and trade placement and execution may be delayed or fail due to market volatility and volume, quote delays, system and software errors, Internet traffic, outages and other factors.
Securities and futures trading is offered to self-directed customers by TradeStation Securities, Inc., a broker-dealer registered with the Securities and Exchange Commission and a futures commission merchant licensed with the Commodity Futures Trading Commission). TradeStation Securities is a member of the Financial Industry Regulatory Authority, the National Futures Association, and a number of exchanges.
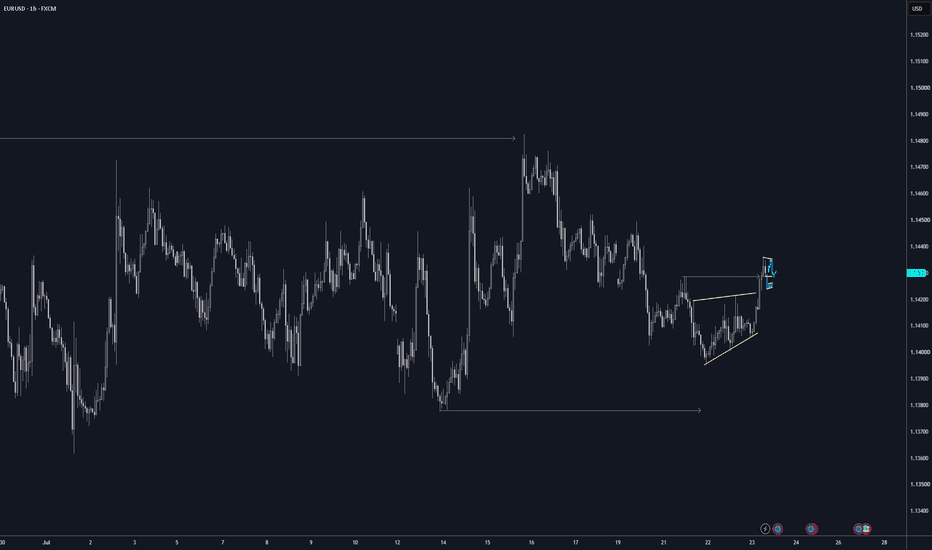
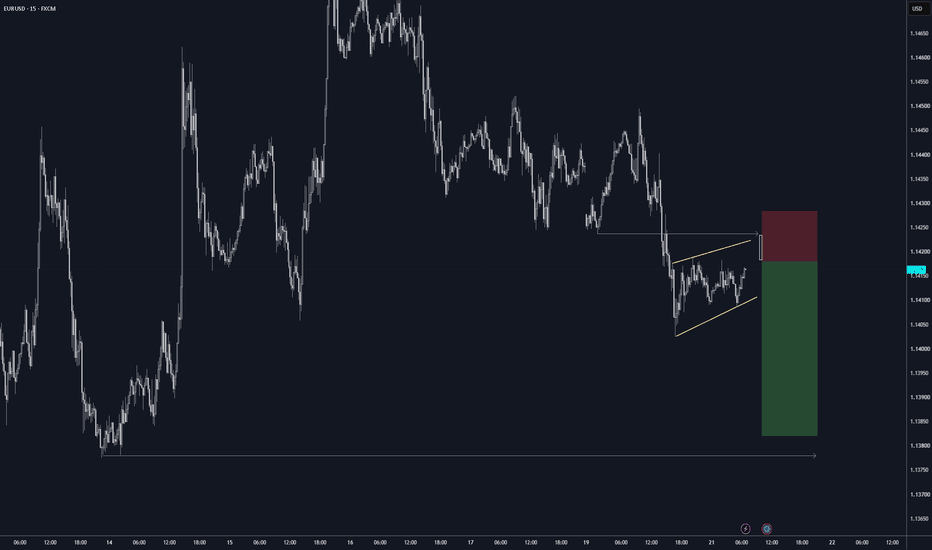
TradeStation Securities, Inc. and TradeStation Technologies, Inc. are each wholly owned subsidiaries of TradeStation Group, Inc., both operating, and providing products and services, under the TradeStation brand and trademark. When applying for, or purchasing, accounts, subscriptions, products and services, it is important that you know which company you will be dealing with. Visit www.TradeStation.com for further important information explaining what this means. EUR/USD Holding Intact Despite Soft Inflation and Oil SpikeEUR/USD probed the top of its monthlong range on Wednesday, closing at a three-week high just below 1.1470, before easing back under 1.1450 through Thursday's U.S. session. The pair has largely absorbed this week's softer inflation prints and shrugged off the initial lift they provided, leaving it hemmed inside the roughly 1.1350 to 1.1450 band that has contained it for about a month. Rather than pressing the upside, EUR/USD has drifted back toward the middle of the range as the Dollar reasserts a firm tone.
The fundamental backdrop has quietly shifted beneath the price action. This week's CPI and PPI both landed below expectations, softening the near-term inflation picture, but a fresh climb in oil has since begun to overshadow those misses. Heightened geopolitical tension, with U.S. strikes against Iran intensifying and Brent pushing above $85, has revived inflation concerns and firmed the case for further tightening, while also lending the Dollar a safe-haven bid. The same oil shock cuts the other way for the Euro, weighing more heavily on Eurozone growth prospects given the region's reliance on imported energy. With the Fed and ECB otherwise viewed in broadly similar positions, that asymmetry in how the two economies absorb the oil move has been enough to keep the Dollar supported and the Euro capped.
In the above chart, EUR/USD rates continue to respect a monthlong consolidation, with ~1.1450 reasserting itself as former support turned resistance. Wednesday's close just under 1.1470 marked a brief peek above that hurdle, but the failure to hold there and the subsequent slip back below 1.1450 leaves the range unbroken and the breakout unconfirmed. Within the holding pattern, short-term traders can watch the 20-day EMA (exponential moving average), sitting right at today's low, to gauge whether it holds as near-term support. A decisive push through 1.1470 would reopen the path toward 1.16, while a move below 1.1350 would validate what is shaping up as a bear flag and shift focus to the downside. With no major data due between now and next week's ECB meeting, geopolitical developments may prove the most likely catalyst to break the pair out of its range.  Long
Long
 Long
Long
Long