Flag
Pole & Flag Setup on DEEDEVclassic Pole & Flag Setup on DEEDEV Development Engineers (DEEDEV)When a stock moves fast, it needs time to breathe. That is exactly what we are seeing here on the weekly chart of DEE Development Engineers Limited.
Key Technical Observations:
🎯 The Pole: A powerful, high-momentum vertical surge from the ₹180 levels up to ₹740.🏳️ The Flag: A orderly, downward-sloping consolidation channel where profit-taking is being absorbed by buyers.
⚡ The Breakout: The current price action is hovering right
DASH Is Compressing — And Compression Precedes ExpansionIn markets as in nature, compression is rarely the end of a movement; it is merely the quiet gathering of energy before expansion.
When traders look at older payment networks like Dash, they often miss the underlying mechanics.
CRYPTOCAP:DASH Dash doesn't rely on hype-driven DeFi TVL metrics; its core strength lies in its dual-tier network.
With a substantial portion of the circulating supply locked inside Masternodes (acting as a natural supply sink), sell-side pressure dries up much fa
Gold The Bull Flag Awaits ResolutionQuiet sessions test a trader's patience far more than volatile ones ever will.
Following yesterday’s structural shift where the Inverse Head & Shoulders pattern triggered our buy idea, Gold expanded nicely into a local high. Since the start of today's Asian and European sessions, however, price action has slowed to a crawl.
This sideways movement is not a sign of weakness; it is a textbook digestion phase forming a Bull Flag pattern on the H1 timeframe.
As we approach the end of the trading w
Link above the double bottom neckline; Just had a golden cross. Link chart looking pretty bullish. Usually when the goldencross occurs with price action so high above the Moving averages like it did here the reaction is a dump but we can see how the thinner 20 day moving average is currently hoisting price action up and helping it to craw out of the bull flag its been consolidating in. We have been decently above link’s double bottom neckline for some time now too increasing the odds and probability that it is about to validate the double bottom breakout as
The game is a foot! 👀 SPOT THE DIFFERENCE?
🐂 Lots of bullish things going on here… BUT then the US Treasury Secretary, Scott Bessent, says… ❓🤔
🚶♂️💨 “Move along… nothing to see here!” 😴
Meanwhile… 🌱📈
🟢 The first serious green shoots we’ve seen in just about a YEAR! 🚀🔥
Bull trap… or is something finally changing? 👀
JUPUSD attempting to triangle bottom its way back into bull mode🐂 BULL CASE
🔺 Triangles often form around market bottoms
📈 Trend line has broken to the upside
🎯 Bearish targets have been met
🔪 But calling the exact bottom is like catching a falling knife
🚀 Crypto indexes are breaking out of long-term patterns to the upside
🐻 BEAR CASE
😴 Hibernation time again… 🥶
Possible another leg down, price back into the apex would be a nice place to add if you are going to play the bull side - Just watch out if this is wrong and the lower yellow trend line gets brok
Price Action Education Series No. 010 - Bull FlagFlags are one of the cleanest continuation patterns in price action because they show a market taking a brief pause after a powerful move before continuing in the same direction. Think of them as a short reset inside a larger trend, not a full trend change. 🚩
A proper flag starts with a strong, nearly impulsive move called the flagpole. After that burst, price does not usually reverse the whole move. Instead, it drifts into a short consolidation that runs against the bigger trend and stays cont
GOLD: The Trend Is No Longer HidingThe Trend Is No Longer Hiding
In my previous post regarding GOLD, I discussed how major trends are often born long before the crowd recognizes them.
At the time, Gold was trapped inside a large bearish flag, and the focus was on a potential structural shift rather than an immediate rally.
Today, that trend is no longer hiding.
✅ The bearish flag has been broken.
✅ Resistance has been reclaimed.
✅ The EMA20 has flipped from resistance into support.
✅ Higher highs and higher lows have emerged.
USDJPY: Bullish Continuation 🇺🇸🇯🇵
A quick follow-up for yesterday's idea for USDJPY.
The price retested a recently broken daily structure resistance.
After its test, the price violated a resistance line of a bullish flag pattern on a 4H time frame.
We can expect that the market will continue rising and reach 160.19 level.
❤️Please, support my work with like, thank you!❤️
I am part of Trade Nation's Influencer program and receive a monthly fee for using their TradingView charts in my analysis.
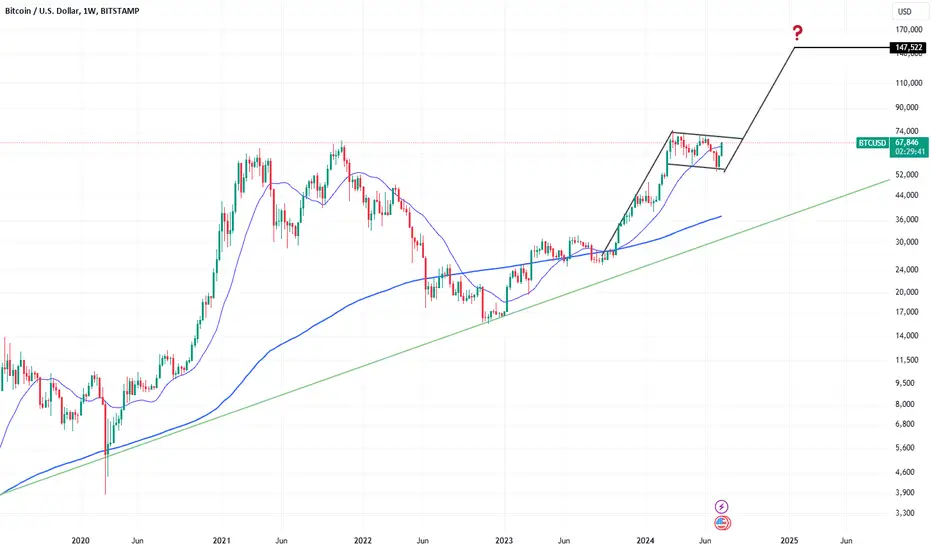
Bitcoin going for that moonlanding?Well, those who have followed our blogs over the last few years would know that we are somewhat (really) bullish on Bitcoin. yes sure, it will be a wildly bumpy ride, but if you have some, just keep em!
Anyway, this chart shows a potential breakout move to new highs. Wait for the flag formation to break higher before you have confirmation, but in our view this is a high probability outcome.
Gold Builds a Bullish Flag: Is $4,720 the Next Target?Gold ( OANDA:XAUUSD ) has continued its bullish trend after successfully breaking above the Descending Channel and the 200_SMA(Daily).
The price is now starting another bullish move from the Potential Reversal Zone(PRZ), while a Bullish Flag Pattern appears to be forming.
Can gold confirm another breakout and extend its rally toward the $4,720 area?
Technical Analysis
From an Elliott Wave perspective, gold appears to have completed Primary Wave 4, with its corrective structure developing as
SOLANA - Add on Weakness and Chill toward 800+As you've heard me say before.... we see the bigger picture.
We don't let emotions or the tiny details get in the way of what is clearly laid out in front of us.
The final checks are being made.... oil is changed, air is in the tires, fluids are topped off.....ensuring that all cylinders are firing.
You see weakness from here on out... you know what to do.
The runway is there. It's validated. Don't even think. Just do.
See you all on the other-side soon gang.
-TradesTyrone
AUDCHF: Bullish Trend Continuation 🇦🇺🇨🇭
AUDCHF broke a resistance line of a bullish flag pattern on an hourly time frame.
Taking into consideration that the pair is trading in a long-term bullish trend,
this violation indicates a highly probable trend continuation.
Expect a price rise to 0.58 level.
❤️Please, support my work with like, thank you!❤️
I am part of Trade Nation's Influencer program and receive a monthly fee for using their TradingView charts in my analysis.
BASING AFTER THE SHOCK, BUT THE RECOVERY IS ALREADY IN THE PRICE
Synopsys compounded almost without interruption for a decade: roughly 30 in 2012 to about 650 by 2025. Then a single-week collapse of near vertical proportions took the guidance reset straight through the chart, and price has spent the time since grinding out a low near 365 — a drawdown of roughly 44% from the high.
This week is the most constructive bar in months. Up 4.43%, range 386 to 412, closing near the high on decent volume. That is what the first leg off a low looks like.
It is also o