XAU/USD 14 August 2026 Intraday AnalysisH4 Analysis:
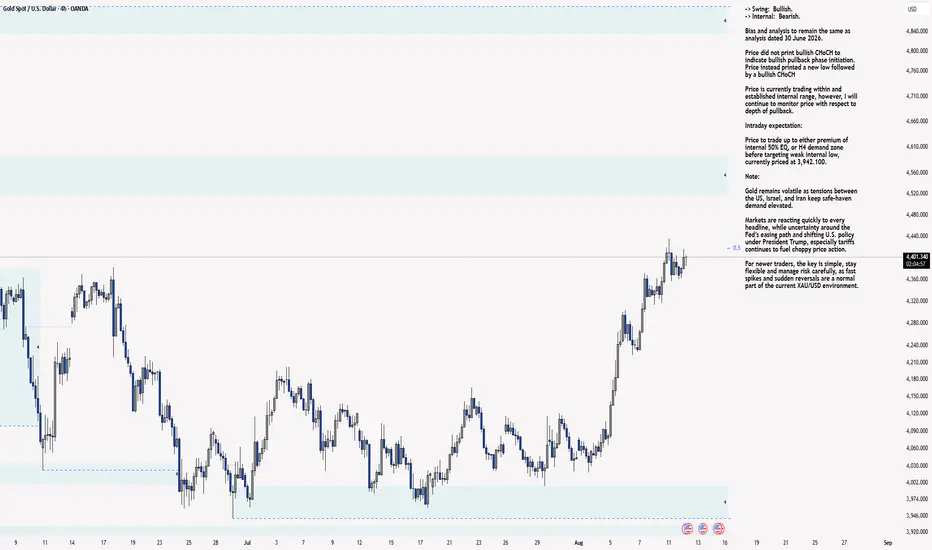
-> Swing: Bullish.
-> Internal: Bearish.
Bias and analysis to remain the same as analysis dated 30 June 2026.
Price did not print bullish CHoCH to indicate bullish pullback phase initiation. Price instead printed a new low followed by a bullish CHoCH
Price is currently trading within and established internal range, however, I will continue to monitor price with respect to depth of pullback.
Intraday expectation:
Price to trade up to either premium of internal 50% EQ, or H4 demand zone before targeting weak internal low, currently priced at 3,942.100.
Note:
Gold remains volatile as tensions between the US, Israel, and Iran keep safe‑haven demand elevated.
Markets are reacting quickly to every headline, while uncertainty around the Fed’s easing path and shifting U.S. policy under President Trump, especially tariffs continues to fuel choppy price action.
For newer traders, the key is simple, stay flexible and manage risk carefully, as fast spikes and sudden reversals are a normal part of the current XAU/USD environment.
H4 Chart:
M15 Analysis:
-> Swing: Bearish.
-> Internal: Bullish.
Analysis and bias to remain the same as yesterday's analysis dated 13 August 2026.
Since last analysis price has printed higher, printing a bullish iBOS, however, depth of pullback has been insufficient, therefore, I shall apply discretion and not classify the bullish iBOS. I have however marked this is red for illustration purposes.
Price is currently trading within an established internal range. I shall continue to monitor price with respect to depth of pullback.
Intraday expectation:
Price to trade down to either discount of internal 50% EQ, or M15 supply zone before targeting weak internal high, priced at 4,449.830.
Note:
Gold remains highly reactive on M15 as geopolitical risk continues to drive quick, headline‑led moves.
The tension between the US, Israel, and Iran is keeping safe‑haven demand elevated, with markets still sensitive to any sign of escalation.
At the same time, shifting US tariff policy under President Trump is adding extra uncertainty, fuelling sharp intraday swings and increasing the likelihood of sudden sentiment flips. Liquidity pockets and whipsaws remain common, making disciplined risk management essential.
Gold’s geopolitical premium is still firmly in place, and until tensions ease, short‑term volatility is likely to stay front‑loaded.
M15 Chart:  Short
Short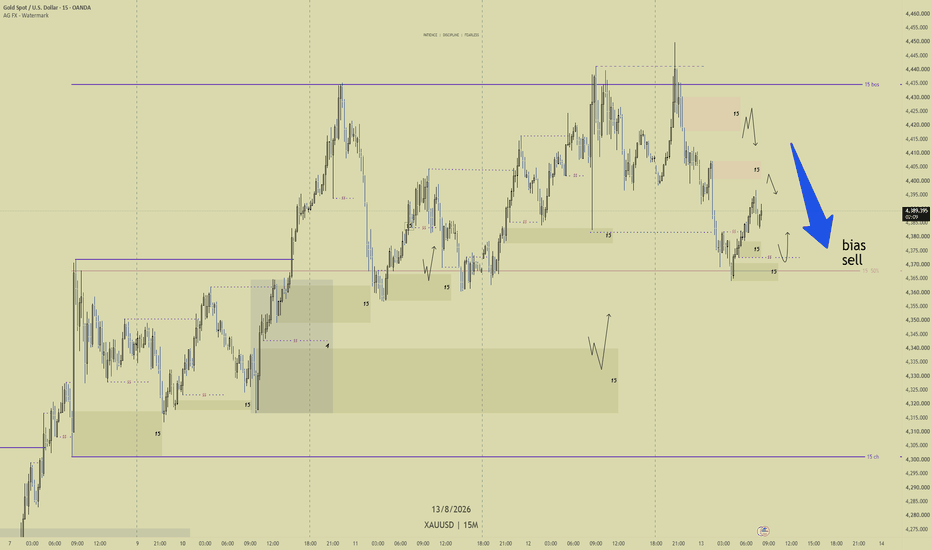
XAU/USD 13 August 2026 Intraday AnalysisH4 Analysis:
-> Swing: Bullish.
-> Internal: Bearish.
Bias and analysis to remain the same as analysis dated 30 June 2026.
Price did not print bullish CHoCH to indicate bullish pullback phase initiation. Price instead printed a new low followed by a bullish CHoCH
Price is currently trading within and established internal range, however, I will continue to monitor price with respect to depth of pullback.
Intraday expectation:
Price to trade up to either premium of internal 50% EQ, or H4 demand zone before targeting weak internal low, currently priced at 3,942.100.
Note:
Gold remains volatile as tensions between the US, Israel, and Iran keep safe‑haven demand elevated.
Markets are reacting quickly to every headline, while uncertainty around the Fed’s easing path and shifting U.S. policy under President Trump, especially tariffs continues to fuel choppy price action.
For newer traders, the key is simple, stay flexible and manage risk carefully, as fast spikes and sudden reversals are a normal part of the current XAU/USD environment.
H4 Chart:
M15 Analysis:
-> Swing: Bearish.
-> Internal: Bullish.
Since last analysis price has printed higher, printing a bullish iBOS, however, depth of pullback has been insufficient, therefore, I shall apply discretion and not classify the bullish iBOS. I have however marked this is red for illustration purposes.
Price is currently trading within an established internal range. I shall continue to monitor price with respect to depth of pullback.
Intraday expectation:
Price to trade down to either discount of internal 50% EQ, or M15 supply zone before targeting weak internal high, priced at 4,449.830.
Note:
Gold remains highly reactive on M15 as geopolitical risk continues to drive quick, headline‑led moves.
The tension between the US, Israel, and Iran is keeping safe‑haven demand elevated, with markets still sensitive to any sign of escalation.
At the same time, shifting US tariff policy under President Trump is adding extra uncertainty, fuelling sharp intraday swings and increasing the likelihood of sudden sentiment flips. Liquidity pockets and whipsaws remain common, making disciplined risk management essential.
Gold’s geopolitical premium is still firmly in place, and until tensions ease, short‑term volatility is likely to stay front‑loaded.
M15 Chart:  Short
Short
XAU/USD 12 August 2026 Intraday AnalysisH4 Analysis:
-> Swing: Bullish.
-> Internal: Bearish.
Bias and analysis to remain the same as analysis dated 30 June 2026.
Price did not print bullish CHoCH to indicate bullish pullback phase initiation. Price instead printed a new low followed by a bullish CHoCH
Price is currently trading within and established internal range, however, I will continue to monitor price with respect to depth of pullback.
Intraday expectation:
Price to trade up to either premium of internal 50% EQ, or H4 demand zone before targeting weak internal low, currently priced at 3,942.100.
Note:
Gold remains volatile as tensions between the US, Israel, and Iran keep safe‑haven demand elevated.
Markets are reacting quickly to every headline, while uncertainty around the Fed’s easing path and shifting U.S. policy under President Trump, especially tariffs continues to fuel choppy price action.
For newer traders, the key is simple, stay flexible and manage risk carefully, as fast spikes and sudden reversals are a normal part of the current XAU/USD environment.
H4 Chart:
M15 Analysis:
-> Swing: Bearish.
-> Internal: Bullish.
Analysis and bias to remain the same as yesterday's analysis 11 August 2026
Price continued higher, subsequently printing a bearish CHoCH to indicate bearish pullback phase initiation.
Price is currently trading within an established internal range, however, I shall coninue to monitor price with respect to depth of pullback.
Intraday expectation:
Price to trade down to either discount of internal 50% EQ, or M15 supply zone before targeting weak internal high, priced at 4,435.245.
Note:
Gold remains highly reactive on M15 as geopolitical risk continues to drive quick, headline‑led moves.
The tension between the US, Israel, and Iran is keeping safe‑haven demand elevated, with markets still sensitive to any sign of escalation.
At the same time, shifting US tariff policy under President Trump is adding extra uncertainty, fuelling sharp intraday swings and increasing the likelihood of sudden sentiment flips. Liquidity pockets and whipsaws remain common, making disciplined risk management essential.
Gold’s geopolitical premium is still firmly in place, and until tensions ease, short‑term volatility is likely to stay front‑loaded.
M15 Chart: Short 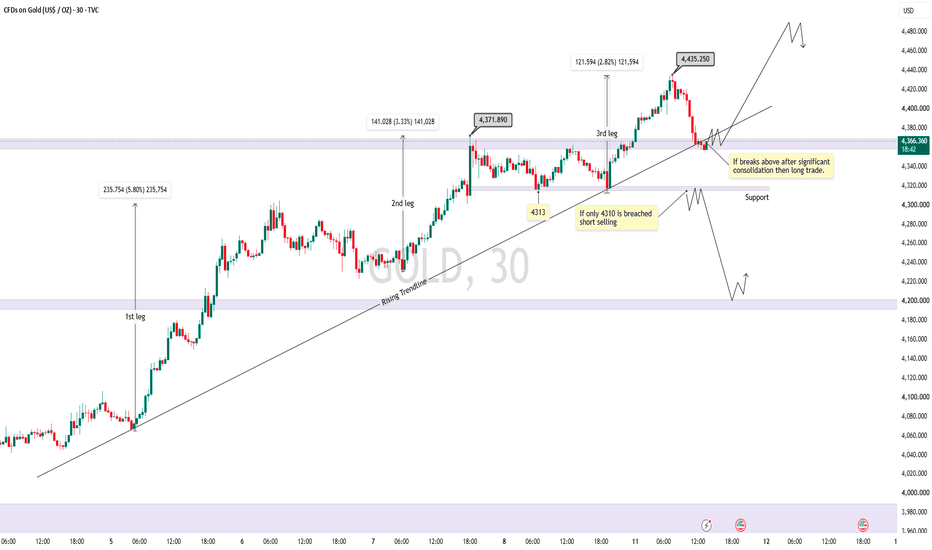
XAU/USD 11 August 2026 Intraday AnalysisH4 Analysis:
-> Swing: Bullish.
-> Internal: Bearish.
Bias and analysis to remain the same as analysis dated 30 June 2026.
Price did not print bullish CHoCH to indicate bullish pullback phase initiation. Price instead printed a new low followed by a bullish CHoCH
Price is currently trading within and established internal range, however, I will continue to monitor price with respect to depth of pullback.
Intraday expectation:
Price to trade up to either premium of internal 50% EQ, or H4 demand zone before targeting weak internal low, currently priced at 3,942.100.
Note:
Gold remains volatile as tensions between the US, Israel, and Iran keep safe‑haven demand elevated.
Markets are reacting quickly to every headline, while uncertainty around the Fed’s easing path and shifting U.S. policy under President Trump, especially tariffs continues to fuel choppy price action.
For newer traders, the key is simple, stay flexible and manage risk carefully, as fast spikes and sudden reversals are a normal part of the current XAU/USD environment.
H4 Chart:
M15 Analysis:
-> Swing: Bearish.
-> Internal: Bullish.
Price continued higher, subsequently printing a bearish CHoCH to indicate bearish pullback phase initiation.
Price is currently trading within an established internal range, however, I shall coninue to monitor price with respect to depth of pullback.
Intraday expectation:
Price to trade down to either discount of internal 50% EQ, or M15 supply zone before targeting weak internal high, priced at 4,435.245.
Note:
Gold remains highly reactive on M15 as geopolitical risk continues to drive quick, headline‑led moves.
The tension between the US, Israel, and Iran is keeping safe‑haven demand elevated, with markets still sensitive to any sign of escalation.
At the same time, shifting US tariff policy under President Trump is adding extra uncertainty, fuelling sharp intraday swings and increasing the likelihood of sudden sentiment flips. Liquidity pockets and whipsaws remain common, making disciplined risk management essential.
Gold’s geopolitical premium is still firmly in place, and until tensions ease, short‑term volatility is likely to stay front‑loaded.
M15 Chart: CYCLE 5 QUESTIONI have been using the Nikkei comparison for one reason: not to claim that Bitcoin has to copy another market, but to understand where the current structure may sit inside a much longer cycle.
The similarity is not in individual candles. It is in the sequence.
Nikkei moved through four distinct expansion and reset phases before the final acceleration of Cycle 5. Each cycle pushed price into the same rising long term structure, followed by another period of weakness, doubt and rebuilding. The important part came after the fourth rejection. What looked like another completed cycle was eventually followed by the strongest expansion on the entire chart.
Bitcoin has now reached a very similar location. The first major cycle ended in 2013. The next major peak came in 2017. Another expansion followed into 2021. Then Bitcoin reached roughly $126K in 2025 before entering the current reset. On a standard four year reading, that move is easy to interpret as another finished cycle.
I do not think the structure is that simple.
What interests me is that the current rejection is appearing at the same relative stage where the Nikkei comparison moved from Cycle 4 into Cycle 5. In both structures, price had already experienced several major expansions. The market had already matured. The easy early cycle gains were gone. What remained was a much larger question about whether the final rejection represented exhaustion or preparation for one last repricing phase.
This is where the current Bitcoin debate becomes important. If $126K was a traditional cycle top, then the market should continue behaving like a completed expansion and spend the next phase rebuilding from much lower levels. But if $126K was only the Cycle 4 rejection, then the current weakness has a completely different meaning. It becomes the reset between Cycle 4 and Cycle 5.
That is the scenario I am watching.
The Nikkei example also shows why the largest move does not always arrive early in a market's life. Mature assets can spend years building structure before entering their strongest repricing phase. By the time that expansion begins, the market usually looks too old, too obvious or too exhausted to produce anything extraordinary.
That is exactly why the current Bitcoin structure deserves attention. market is focused on whether the previous high was the end. larger cycle question is whether it was actually the last major resistance point before a final expansion. I am not using Nikkei as a price target and I am not expecting Bitcoin to reproduce the same path candle for candle. The value of the comparison is in cycle location, market psychology and the sequence of expansion, rejection, reset and repricing.
For now, Bitcoin is sitting at the part of the map where the next cycle will define the entire thesis. If the parallel continues, $126K will not be remembered as the final top.
It will be remembered as the point where Cycle 5 began to take shape. CRYPTOCAP:BTC Long 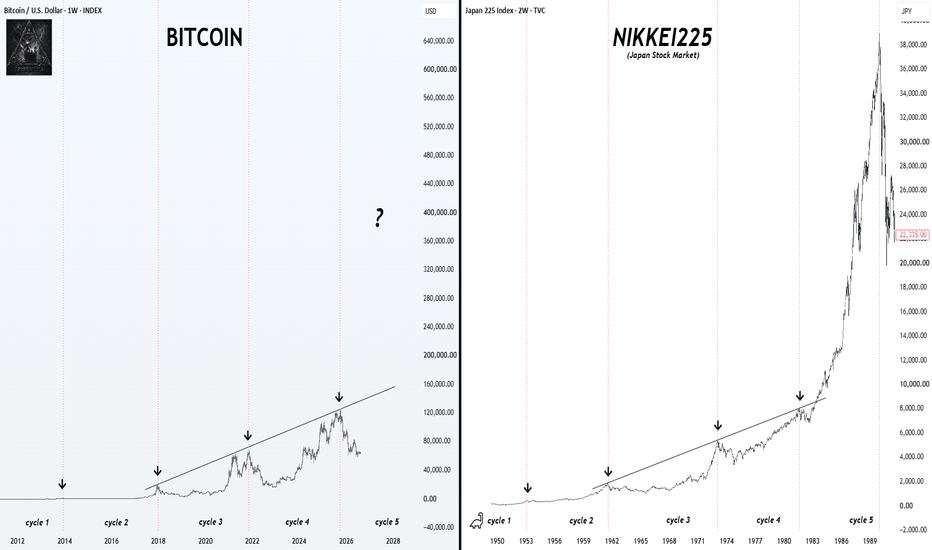
Short 
XAU/USD 10 August 2026 Intraday AnalysisH4 Analysis:
-> Swing: Bullish.
-> Internal: Bearish.
Bias and analysis to remain the same as analysis dated 30 June 2026.
Price did not print bullish CHoCH to indicate bullish pullback phase initiation. Price instead printed a new low followed by a bullish CHoCH
Price is currently trading within and established internal range, however, I will continue to monitor price with respect to depth of pullback.
Intraday expectation:
Price to trade up to either premium of internal 50% EQ, or H4 demand zone before targeting weak internal low, currently priced at 3,942.100.
Note:
Gold remains volatile as tensions between the US, Israel, and Iran keep safe‑haven demand elevated.
Markets are reacting quickly to every headline, while uncertainty around the Fed’s easing path and shifting U.S. policy under President Trump, especially tariffs continues to fuel choppy price action.
For newer traders, the key is simple, stay flexible and manage risk carefully, as fast spikes and sudden reversals are a normal part of the current XAU/USD environment.
H4 Chart:
M15 Analysis:
-> Swing: Bearish.
-> Internal: Bullish.
As I mentioned in my analysis dated 06 August 2026 whereby I mentioned price printed a bearish CHoCH but I would be monitor depth of pullback.
Price did not pullback with any significance, therefore, I will not classify the previous iBOS. I have however marked this is in red for illustration purposes.
Price has since printed higher. CHoCH positioning is denoted with a blue dotted horizontal line.
Price is currently trading within a fractal high and internal low.
Intraday expectation:
Price to print bearish CHoCH to indicate bearish pullback phase initiation. Price to then trade down to either discount of internal 50% EQ, or M15 supply zone before targeting weak internal high, priced at 4,371.840.
Note:
Gold remains highly reactive on M15 as geopolitical risk continues to drive quick, headline‑led moves.
The tension between the US, Israel, and Iran is keeping safe‑haven demand elevated, with markets still sensitive to any sign of escalation.
At the same time, shifting US tariff policy under President Trump is adding extra uncertainty, fuelling sharp intraday swings and increasing the likelihood of sudden sentiment flips. Liquidity pockets and whipsaws remain common, making disciplined risk management essential.
Gold’s geopolitical premium is still firmly in place, and until tensions ease, short‑term volatility is likely to stay front‑loaded.
M15 Chart: