GBPCHF: Bullish Trend Continuation 🇬🇧🇨🇭
GBPCHF will likely continue rising as it has completed an accumulation
within a horizontal range, breaking and closing above its resistance on a 4H.
Goal - 1.076
❤️Please, support my work with like, thank you!❤️
I am part of Trade Nation's Influencer program and receive a monthly fee for using their TradingView charts in my analysis.
Rectangle
MESU July 2: 7500 test in play, 7600 flips bullMESU analysis for Thursday, July 2
Today is the last trading day of the week, so I’m paying extra attention to how price reacts at the key levels.
On the 4H chart, I’m still respecting the trendline and resistance overhead. The major higher-time-frame confirmation level for bulls remains 7600. If we get a 4H close above 7600, then I think the tone may need to shift from bearish to bullish.
For now, I still think there is a good chance price may come back down and test the liquidity around 750
CADCHF: Another Bearish Move Ahead 🇨🇦🇨🇭
CADCHF completed a consolidation, breaking a horizontal support
of a horizontal range on a daily time frame.
With a high probability, the price will drop lower after a pullback.
Goal - 0.5674
❤️Please, support my work with like, thank you!❤️
I am part of Trade Nation's Influencer program and receive a monthly fee for using their TradingView charts in my analysis.
A Classic Liquidity Sweep at 60KHi everyone🌴
Just a quick update today — everything you need is already on the chart.
Since Thursday, the battle for the 60,000 level has continued. At the opening of the U.S. session today, Bitcoin printed a classic liquidity sweep on the 4H timeframe, taking out stops at both ends of the range (just the way we like it 🤬) before returning once again to the 60,000 area.
The next scenario is straightforward:
📈 A breakout above 60,000 followed by acceptance opens the door to 62,500.
📉 A reject
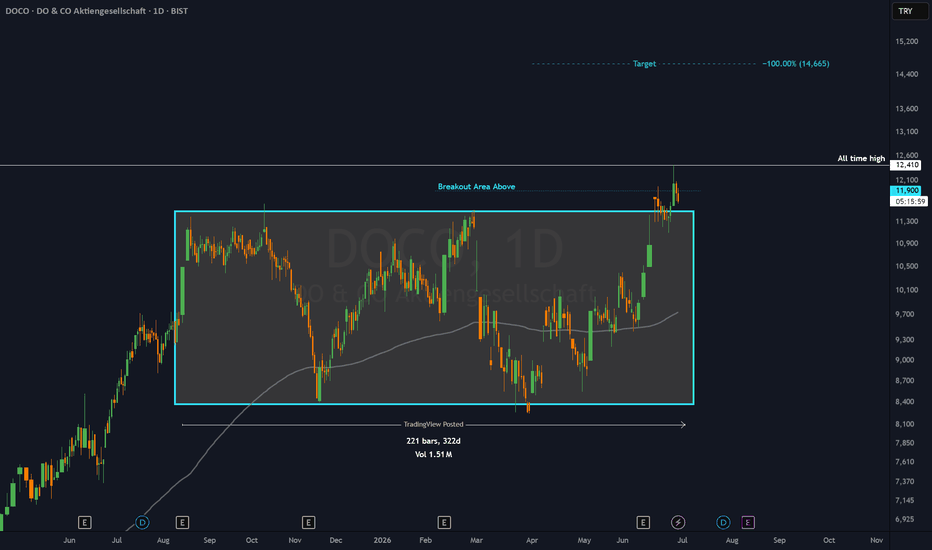
DOCO - 11 months RECTANGLE══════════════════════════════
Since 2014, my markets approach is to spot
trading opportunities based solely on the
development of
CLASSICAL CHART PATTERNS
🤝Let’s learn and grow together 🤝
══════════════════════════════
Hello Traders ✌
After a careful consideration I came to the conclusion that:
- it is crucial to be quick in alerting you with all the opportunities I spot and often I don't post a good pattern because I don't have the opportunity to write down a proper didactical comment;
- sin
PGEN - 10 months RECTANGLE══════════════════════════════
Since 2014, my markets approach is to spot
trading opportunities based solely on the
development of
CLASSICAL CHART PATTERNS
🤝Let’s learn and grow together 🤝
══════════════════════════════
Hello Traders ✌
After a careful consideration I came to the conclusion that:
- it is crucial to be quick in alerting you with all the opportunities I spot and often I don't post a good pattern because I don't have the opportunity to write down a proper didactical comment;
- sin
BYD - 1 year RECTANGLE══════════════════════════════
Since 2014, my markets approach is to spot
trading opportunities based solely on the
development of
CLASSICAL CHART PATTERNS
🤝Let’s learn and grow together 🤝
══════════════════════════════
Hello Traders ✌
After a careful consideration I came to the conclusion that:
- it is crucial to be quick in alerting you with all the opportunities I spot and often I don't post a good pattern because I don't have the opportunity to write down a proper didactical comment;
- sin
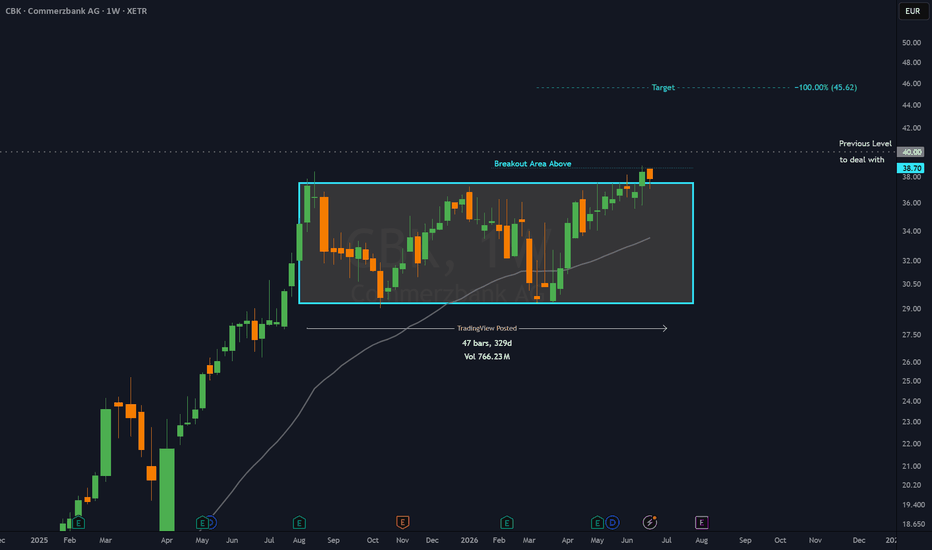
CBK - 11 months RECTANGLE══════════════════════════════
Since 2014, my markets approach is to spot
trading opportunities based solely on the
development of
CLASSICAL CHART PATTERNS
🤝Let’s learn and grow together 🤝
══════════════════════════════
Hello Traders ✌
After a careful consideration I came to the conclusion that:
- it is crucial to be quick in alerting you with all the opportunities I spot and often I don't post a good pattern because I don't have the opportunity to write down a proper didactical comment;
- sin
$DXY Year long range finally pressing the topBox runs $95.79 to $100.36.
Price has broken out the top and is now testing the May 2025 ceiling at $101.57.
One level decides this and it's the resistance at $101.57.
Daily close above $101.57 on volume opens the measured move.
Range height projects a target near $104.94.
No close above, and this is just a poke into supply. Fade back below $100.36 puts price back in the box and kills the breakout.
Watching this closely.
A confirmed dollar breakout is a headwind for the debasement trad
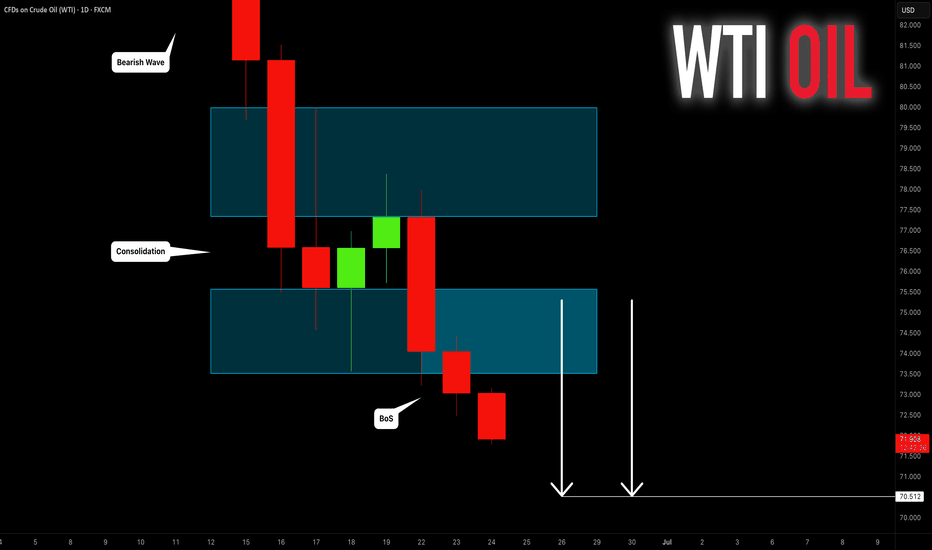
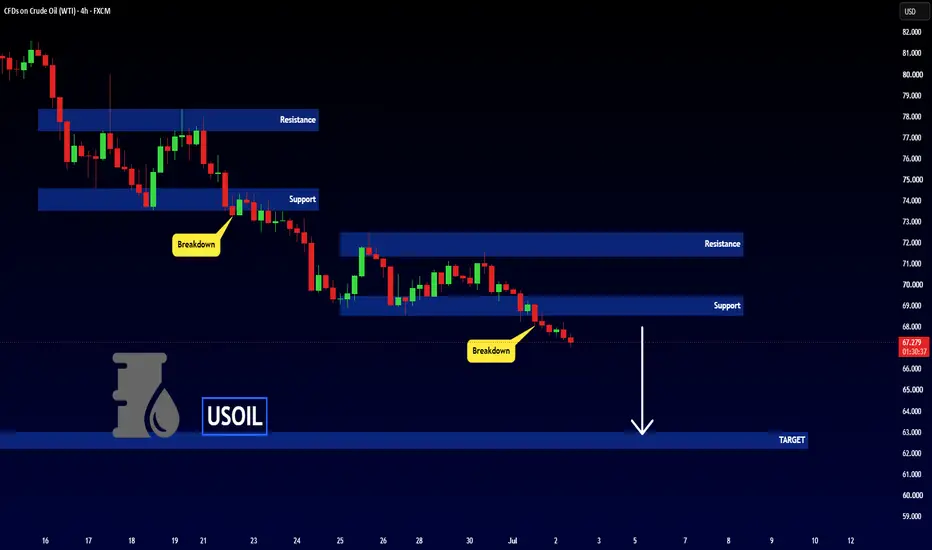
CRUDE OIL (WTI): Another BoS
WTI Crude Oil violated another daily support, closing below 73.46 level.
The next strong support is 70.5
With a high probability, it will be reached soon.
❤️Please, support my work with like, thank you!❤️
I am part of Trade Nation's Influencer program and receive a monthly fee for using their TradingView charts in my analysis.
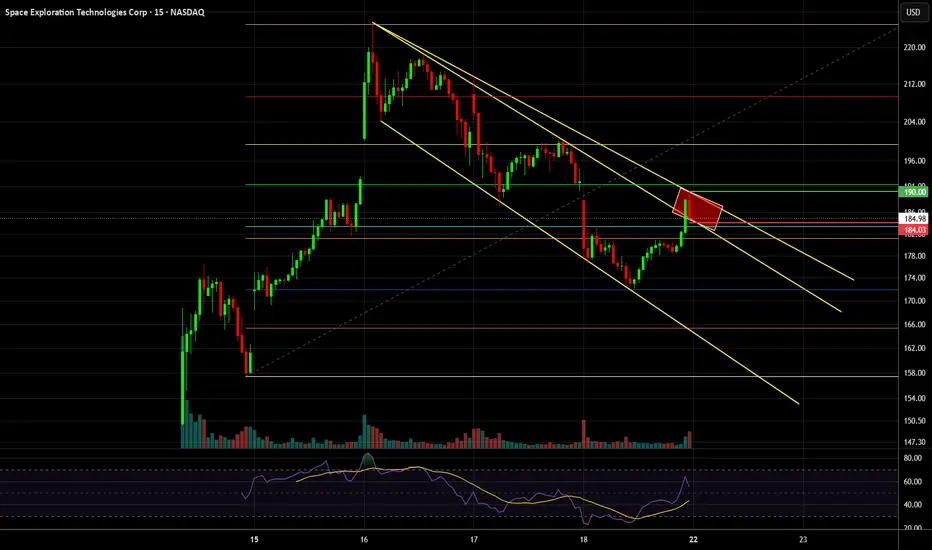
SPCX: $190 Breakout Trigger vs $184 Breakdown LevelThe price pulled back exactly to the 0.786 Fibonacci retracement level of the previous move.
Looking at the chart, we can see a downtrend that can be drawn in a couple of different ways that’s why I marked two yellow trendlines. Instead of focusing on one exact line, I’m treating the space between them (the red rectangle) as a consolidation zone.
This range should give us a better idea of where the next move is likely heading and help define the trade setup.
Bullish scenario :
If price break
Short Idea Liquidity Gap TargetThe Euro against the Canadian Dollar is presenting a highly technical cyclical setup on the 4-hour framework.
Technical View: Looking at the structured frameworks mapped in this pair, price action has completed a highly precise cyclical transition. Following a deep (A)-(B)-(C)-(D)-(E) corrective sequence, the market unleashed an aggressive, full five-wave motive structure labeled (1)-(2)-(3)-(4)-(5) directly off the structural lows. Out of this impulsive leg, a large Harmonic Bat structure is n
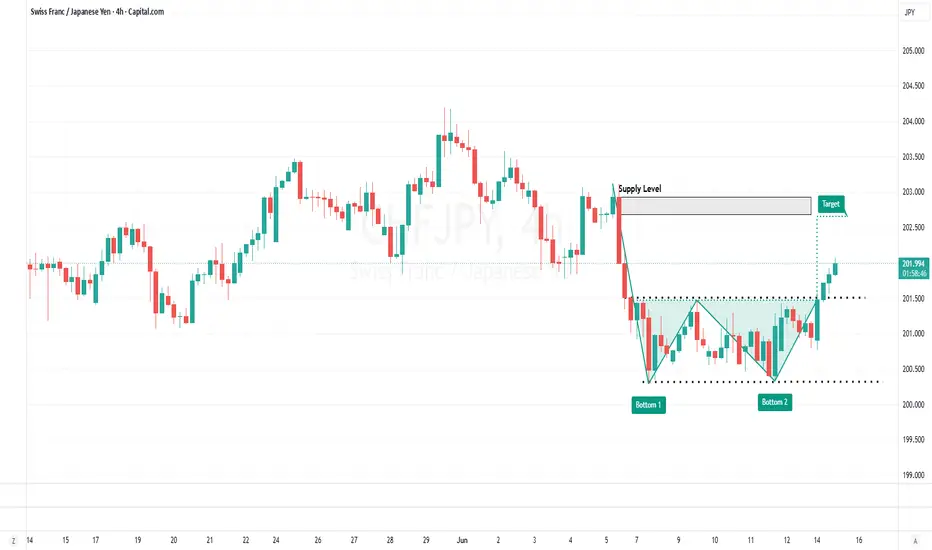
CHFJPY, 4H Double Bottom Set Up
CHFJPY has broken out of a consolidation range on the 4H timeframe, signalling growing bullish momentum. The move is further supported by a Double Bottom pattern, with price now breaking above the neckline confirmation level.
With buyers in control, a BUY setup remains valid, targeting the next key supply zone as TP1. Traders should monitor price action for continued strength above the breakout area.
BTC Bulls Need to Defend 62,500Hi friends! ☀️
Locally, the situation has stabilized, and Bitcoin is attempting to establish itself above 62,500.
I have marked this level as the Decision Zone ❗️❗️❗️ because a successful hold above it could open the door to a relatively quick move toward 64,890.
If price fails to hold current levels, however, we will likely see the correction continue toward the 60,000 area.
🔪 At the same time, the bigger picture still looks noticeably weaker. Considering the scale of the decline over the p
BANK OF BARODABank of Baroda Ltd. (CMP ₹273.75, NSE: BANKBARODA)
Prepared by Sucrit Patil | The SmartWay Research Desk | 10 June 2026
A Vadodara‑based public sector bank, incorporated in 1908. Bank of Baroda is India’s second‑largest PSU bank, with global operations across 17 countries, offering retail banking, corporate banking, treasury, and digital services.
Promoter Holding (Mar 2026): Government of India — 63.97% stake (no pledges)
FY22–FY26 Snapshot
Revenue Growth: FY26 revenue ₹1,15,215 Cr vs ₹1,02,
Support Test in Progress: $62.5KHi, friends 🧨
Today's update will be a short one, as price action is developing very rapidly and uncertainty continues to dominate the market. At the moment, that uncertainty seems to favor the bears 🔪
We didn't even come close to reaching the upper boundary of the 62,500–64,890 range and have now moved down to test its lower boundary at 62,500.
If we don't see a convincing bounce from this level within the next few hours, we could be looking at a continuation of the correction toward the 60,
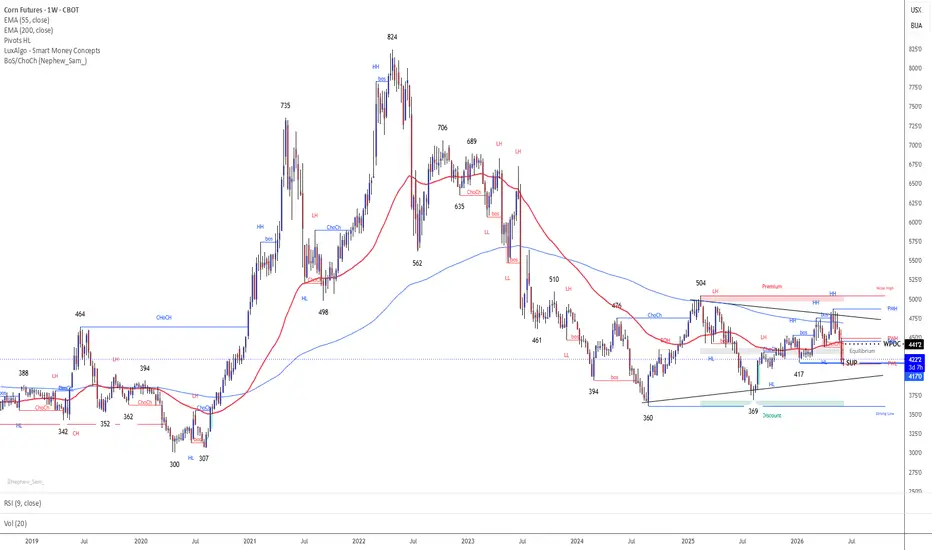
CORN FUTURES ...Up DateCORN FUTURES
Wyckoff / Market Profile
The current structure is either:
Scenario 1 — Reaccumulation If 417 holds and price reclaims 436/441:
369 = Selling Climax
488 = Automatic Rally
417/420 = Secondary Test / LPS candidate
Scenario 2 — Markdown continuation
If 417 fails:
488 was distribution high
420 is only temporary pause
next li
Bitcoin Reclaims Higher Range — What's Next?Hello traders!
In my previous post, I warned that after the consecutive breakdown of nearly all major support levels: “the next attempt at a bounce and consolidation would likely come from the 60,000 level.”
That is exactly how the market played out. We saw a strong reaction from 60,000, followed by a quick recovery not only back into the 60,000–62,500 range, but even one step higher — into the 62,500–64,890 range.
❗️📈It is now very important to watch how price behaves as it approaches 64,890
MESM June 8: Bounce watch 7473, then 7533MESM analysis for Monday, June 8
MESM is trying to bounce after last week’s sell-off, and for me today is more of a station-by-station session than a day to be aggressively bullish or bearish.
On the 4H chart, I’m watching 7473 as the first bounce target. If bulls can keep pushing after that, then the next upside level for me is 7533.
On the downside, I’m still watching the overnight low / liquidity around 7355.
On the 1H chart, the structure remains similar, and 7386 is the key support leve