USDJPY Trade Alert - Bullish ImpulseFX:USDJPY Trade Alert - Bullish Impulse
Summary - FX:USDJPY Trade Signal
- #USDJPY Bullish Impulse starting.
- FX:USDJPY Buy Positions in focus.
Technical Analysis: Dollar Yen Signal
Chart Structure:
- Elliott Wave: Impulse
- Wave (4) Completion
- FX:USDJPY Bullish Fractal
#USDJPY Prediction:
- Bullish Impulse
- Intermediate Wave (5)
FX:USDJPY Trade Levels
- Ticker: USD/JPY
- Direction: LONG
- Market Entry @ 158.9
- Strategic Entry @ 158.25
- SL @ 156.5
- TP1 @ 160.5
- TP2 @ 162.5
- TP3 @ 164
Dollar Yen - Daily Chart
Dollar Yen 2H Chart
* Trade Signals are subject to risk, DYOR.
* Trading is risky, not financial advice.
Rectangle
Uniswap Wave Analysis – 17 April 2026
- Uniswap reversed from pivotal support level 3.000
- Likely to rise to resistance level 4.130
Uniswap recently reversed up from the pivotal support level 3.000, which is the lower border of the sideways price range from the start of February.
The support zone near the support level 3.000 was strengthened by the lower daily Bollinger Band.
Given the strength of the nearby support level 3.0000, Uniswap can be expected to rise toward the next resistance level 4.130, upper border of the active sideways price range.
Alcoa Wave Analysis – 7 April 2026 - Alcoa broke resistance level 68.20
- Likely to rise to resistance level 75.00
Alcoa recently broke the resistance level 68.20 (which is the upper border of the sideways price range inside which the price has been moving from January).
The breakout of the resistance level 68.20 accelerated the active short-term impulse wave 3 of the intermediate impulse wave (5) from February.
Given the strong daily uptrend, Alcoa can be expected rise to the next resistance level 75.00 (target price for the completion of the active impulse wave 3).
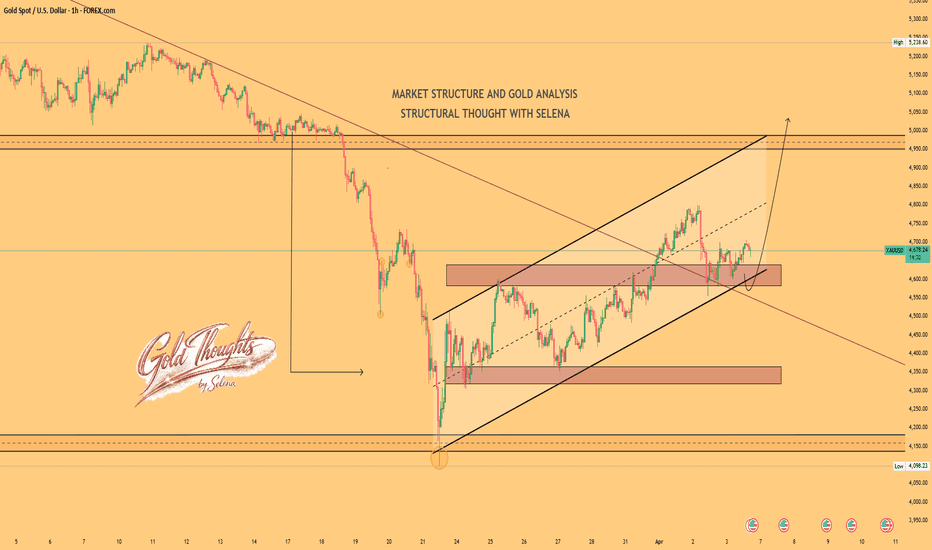
Selena | XAUUSD · 1H – Bullish Recovery Within StructurePEPPERSTONE:XAUUSD FOREXCOM:XAUUSD
Structure | Trend | Key Reaction Zones
Gold is forming higher lows within an ascending channel, indicating a shift from bearish momentum into a structured bullish recovery.
Market Overview
After a sharp bearish move, price established a strong base near the 4100–4200 region and initiated a consistent recovery. The market is now respecting an ascending trendline while holding above the 4600–4680 support zone. This suggests bullish continuation potential, especially if the structure remains intact. The next major objective lies at the 4950–5000 liquidity zone, where higher timeframe resistance exists.
Key Scenarios
✅ Bullish Case 🚀 (Primary)
Continuation from support zone.
🎯 Target 1: 4800
🎯 Target 2: 4950
🎯 Target 3: 5000
❌ Bearish Case 📉 (Invalidation)
Break of structure + trendline.
🎯 Target 1: 4450
🎯 Target 2: 4300
Current Levels to Watch
Resistance 🔴: 4800 – 5000
Support 🟢: 4600 – 4680
⚠️ Disclaimer: This analysis is for educational purposes only. Not financial advice.
INDO THAI SECURITIESIndo Thai Securities Ltd. (NSE: INDOTHAI) is a small‑cap financial services company engaged in stock broking, investment advisory, and capital market operations. Incorporated in 1995, it is headquartered in Indore, Madhya Pradesh.
Promoter: Doshi Family (Dhanpal Doshi & Group) – 56.77% holding (Dec 2025)
FY22–FY26 Snapshot
Revenue Growth: CAGR ~12% over FY22–FY26, supported by broking and advisory services. → Good
Net Profit: FY26 PAT ~₹42 Cr, reflecting steady growth. → Good
Operating Margin: Maintained ~18–20%, showing strong efficiency. → Good
Equity Capital: Stable, no major dilution. → Good
Dividend Policy: Yield ~0.7% (FY26), conservative payouts. → Neutral
Asset Building: Expansion of client base and digital platforms. → Good
Sales: FY26 revenue crossed ₹310 Cr. → Good
Expense: Technology and compliance costs remain high. → Neutral
EPS: ~₹12.4 in FY26, reflecting consistent profitability. → Good
Institutional Interest & Ownership Trends
Largest Promoter: Doshi Family (Dhanpal Doshi & Group) – 56.77% (Dec 2025)
Largest FII: Foreign institutional investors – 1.28% (Dec 2025)
Largest DII: Domestic institutions – 0.19% (Dec 2025)
Retail & Others: ~41.76% (Dec 2025)
Strategic Moves & Innovations
Expansion into digital trading platforms and mobile apps.
Focus on retail investor onboarding in Tier‑2 and Tier‑3 cities.
Investment in research and advisory services for HNIs.
Strengthening compliance and risk management systems.
Cash Flow & Balance Sheet Strength
Operating cash flows supported by broking and advisory revenues.
Debt levels negligible, balance sheet conservative.
Profit growth supports reinvestment in technology.
Risk Factors
Dependence on capital market cycles.
Margin sensitivity to transaction volumes.
Competition from larger brokers (ICICI Securities, Angel One, Zerodha).
Regulatory risks in SEBI compliance.
Investor Takeaway
Indo Thai Securities Ltd., backed by the Doshi Family, is a regional capital markets player with strong promoter holding and high retail participation. With most snapshot parameters rated Good, the company shows consistent EPS growth, robust asset building, and strong sales momentum. Investors should monitor market cycle risks and competition from larger brokers, but overall the outlook remains positive for long‑term holders.
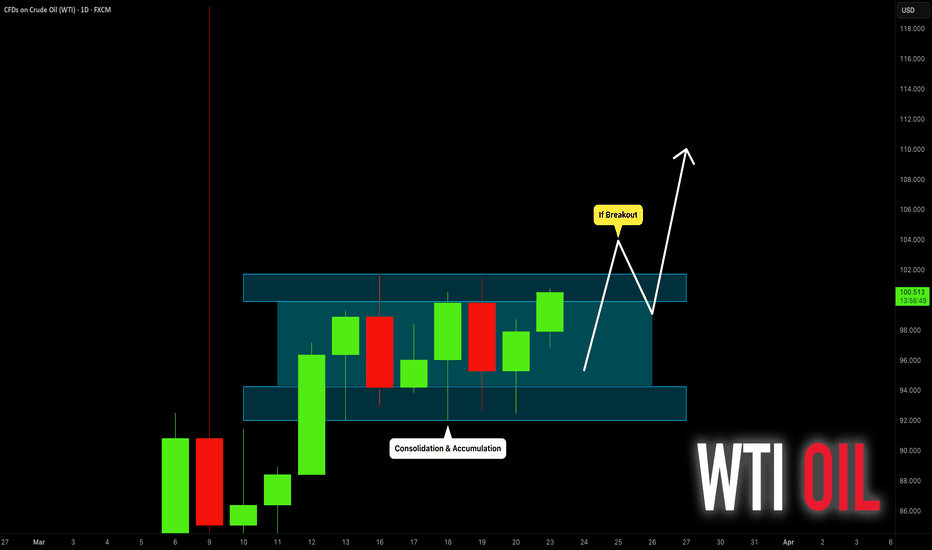
CRUDE OIL (WTI): Important Decision Ahead
WTI Crude Oil is currently consolidating within a horizontal
parallel channel on a daily time frame.
I do believe that a bullish accumulation is currently taking place
before a strong wave up.
Your confirmation to buy the market will be a bullish breakout and
a daily candle close above the resistance of the range (101.76).
A strong upward movement will be expected then.
❤️Please, support my work with like, thank you!❤️
I am part of Trade Nation's Influencer program and receive a monthly fee for using their TradingView charts in my analysis.
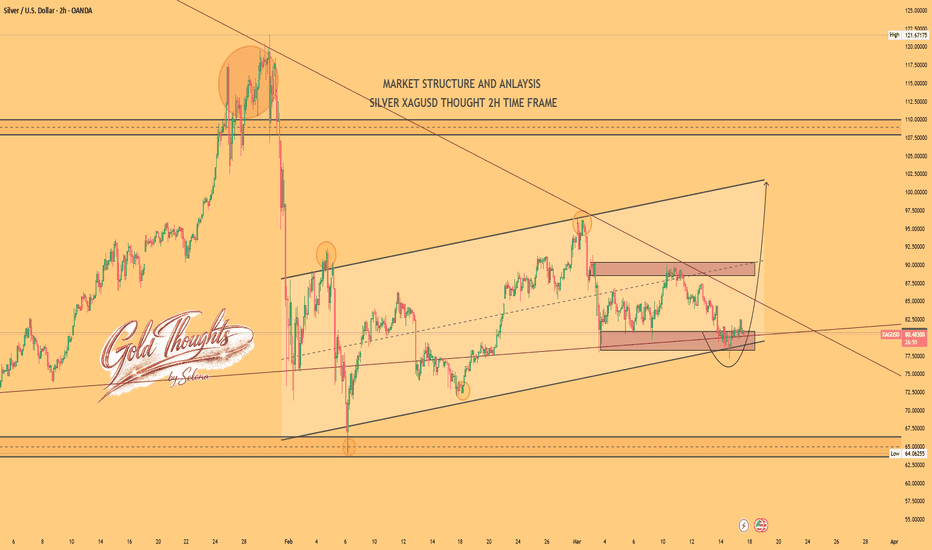
Selena | XAGUSD · 2H – Channel Accumulation & Reversal SetupTVC:SILVER
After rejecting from the 95.00 resistance area, price moved into a corrective phase and is now testing the demand zone between 78.00 and 81.00. This area aligns with the lower boundary of the channel and represents a key accumulation region. The recent reaction suggests buyers are attempting to regain control after a liquidity sweep below the range lows. If demand holds, price could push back toward the supply zone near 90.00 and potentially break the descending trendline for a bullish continuation.
Key Scenarios
✅ Bullish Case 🚀
Bounce from demand zone.
🎯 Target 1: 85.00
🎯 Target 2: 90.00
🎯 Target 3: 95.00
❌ Bearish Case 📉
Break below demand zone.
🎯 Downside Target 1: 75.00
🎯 Downside Target 2: 70.00
Current Levels to Watch
Resistance 🔴: 88.00 – 90.00
Support 🟢: 78.00 – 81.00
Major Support 🟢: 75.00
⚠️ Disclaimer: This analysis is for educational purposes only. It is not financial advice. Please do your own research before trading.
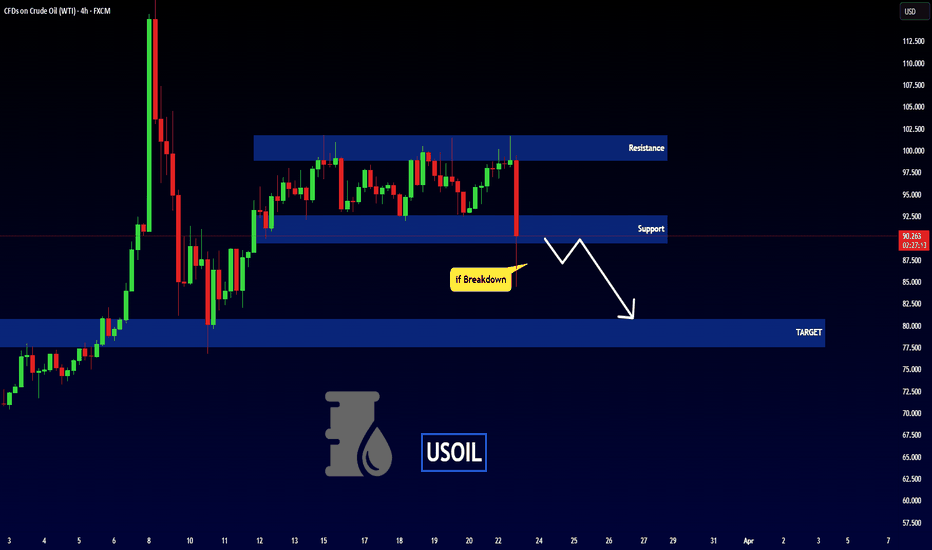
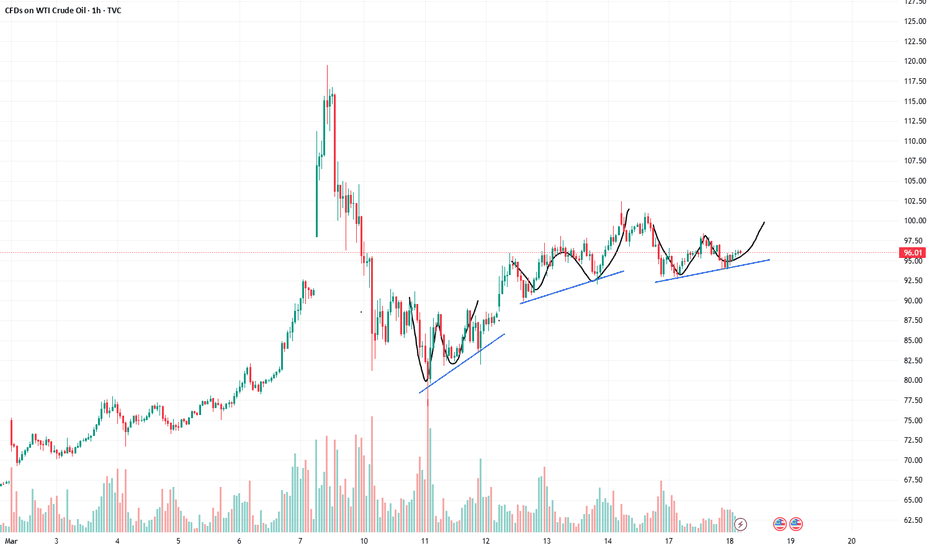
Bull Market Trading Plan for OilA triple "W" formation is acting as a key support level, suggesting that oil prices are unlikely to decline in the short term.
The resurgence of the energy crisis is providing substantial underlying support. Currently, the Strait of Hormuz remains only partially open for oil tanker traffic. Furthermore, despite the G7 nations releasing their strategic oil reserves, market prices have not experienced a significant pullback; consequently, oil prices continue to enjoy robust support on the downside. Technical analysis using Simple Moving Averages (SMA) corroborates this outlook, with the SMA20 and SMA50 indicators signaling a bullish trend. Although oil is currently trading at $96 per barrel, it is expected to extend its gains in the near term; therefore, there remains a high probability of generating profit by trading oil at current market levels. For short-term traders, we continue to focus on the target range of $100–$105.
Selena | XAUUSD · 30m – Ascending Structure With Demand ReactionFOREXCOM:XAUUSD PEPPERSTONE:XAUUSD
After rejecting from the major resistance around 5,400, price entered a corrective phase and began consolidating within a rising structure. The current pullback is approaching a key demand zone between 5,090 and 5,120 which aligns with the lower boundary of the channel. This confluence of trendline support and demand zone increases the probability of a bullish reaction if buyers defend the level. A successful bounce from this area could push price back toward the upper channel boundary and the buy-side liquidity resting above the previous highs.
Key Scenarios
✅ Bullish Case 🚀
Demand zone holds.
🎯 Target 1: 5,240
🎯 Target 2: 5,320
🎯 Target 3: 5,400
❌ Bearish Case 📉
Break below channel support.
🎯 Downside Target 1: 5,020
🎯 Downside Target 2: 4,960
Current Levels to Watch
Resistance 🔴: 5,240
Major Resistance 🔴: 5,400
Support 🟢: 5,090 – 5,120
Major Support 🟢: 5,020
⚠️ Disclaimer: This analysis is for educational purposes only. It is not financial advice.
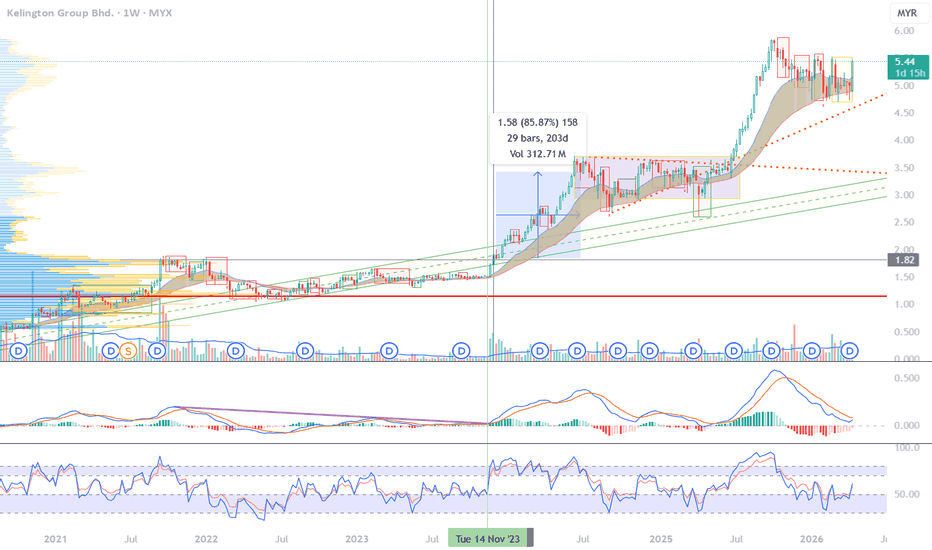
Long Consolidation box.2110 Analysis
Closed at 165.10 (16-03-2026)
Long Consolidation box.
Currently around resistance level (170 - 175).
Crossing this range may lead it towards 200 - 210
initially.
Immediate Support seems to be around 151 - 153
& then around 140 - 141.
However, breaking 125 - 126 may bring more selling
pressure.
Consolidation range bottom is around 56 - 60.
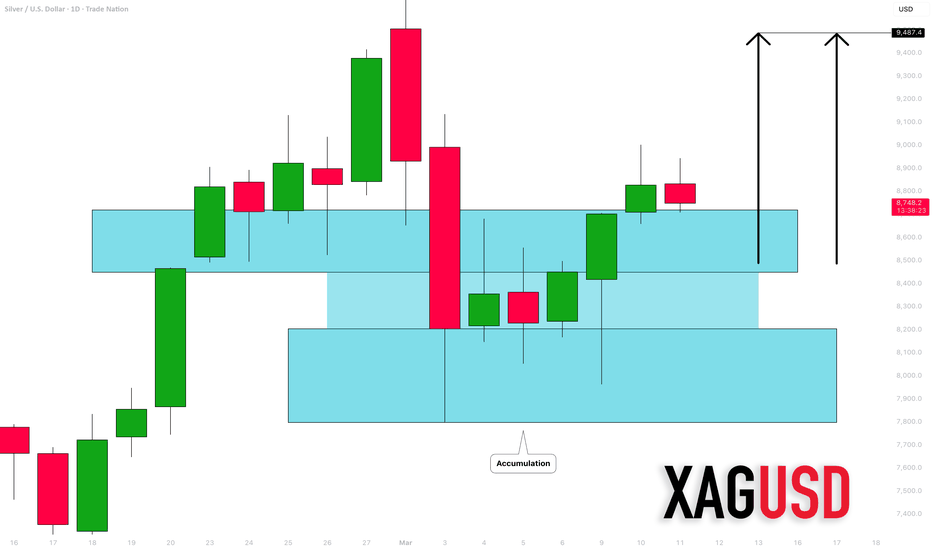
SILVER (XAGUSD): Accumulation Completed?!
Silver violated a resistance of a horizontal accumulation range
on a daily time frame.
There is a high probability that the price will continue rising
at least to 94.0 level.
❤️Please, support my work with like, thank you!❤️
I am part of Trade Nation's Influencer program and receive a monthly fee for using their TradingView charts in my analysis.